One must remember that bear markets, assuming that is the correct call here, go through phases. In other words, they generally don’t happen overnight. There are a couple of ways to describe the phases of the stock market.
The easiest has more to do with supply and demand, and start with accumulation at the bottom. This is followed by the markup phase, and then the last part of the bull market is described as the greed phase. As the bull market top is being traced out, there is the distribution phase (opposite of accumulation phase) and then the markdown phase.
There is also a sentiment phase to a full market cycle, which I like better and describes the real psyche of market participants. I will only list from market top to market bottom or the bear phases. At the market top, investors are, of course, euphoric and full of confidence. As the market starts to rollover, anxiety sets in. This is followed by denial, fear, desperation, panic, capitulation, and at the bottom, despondence and depression.
The hard part with this exercise is determining exactly where you are on the sentiment scale. Personally, I don’t think emotions move in a simple, straight line from euphoria to despondence.
For instance, there are clear indications that during the August decline, there was measurable fear in the air. According to the chart, we should then proceed to desperation. However, because bear markets aren’t straight lines, sentiment will not move in a straight line. There will most likely be a big counter trend rally during the bear market, which will turn the sentiment clock back from fear to anxiety: Ahh, it’s just a correction, no biggie. Good thing I didn’t panic and sell my stocks.
Once this happens, then the bear can really sink its teeth into the bull. The sentiment phase will then get back on track and it’s back to fear, desperation, panic, etc. I’ve always said, leave your ego at the door every morning and pick it up when you leave. In other words, don’t try to outthink the market. Bear market rallies can be some of the fiercest rallies of the total stock market cycle, and therefore feel great. It’s at these times when it’s best to be a robot, emotionless, and focus on the big picture – preserving capital.
I guess that’s a good segue into the bigger picture. So far, there is only one piece of the puzzle in place and that’s a top on the S&P 500 between 2,040 and 2,135. Another interpretation is that the top lies between 1,973 and 2,135. The second scenario is probably more accurate based on the recent low. A measured move based on this initial top targets the 1,811 zone or right near the October low. Any move down toward the low 1800’s sets the stage for the bigger top and potentially a large head-and- shoulders (H&S) top measuring 300+ points. Smaller tops have a way of transitioning into larger stock market tops historically. See chart below. click to enlarge
S&P 500 Chart
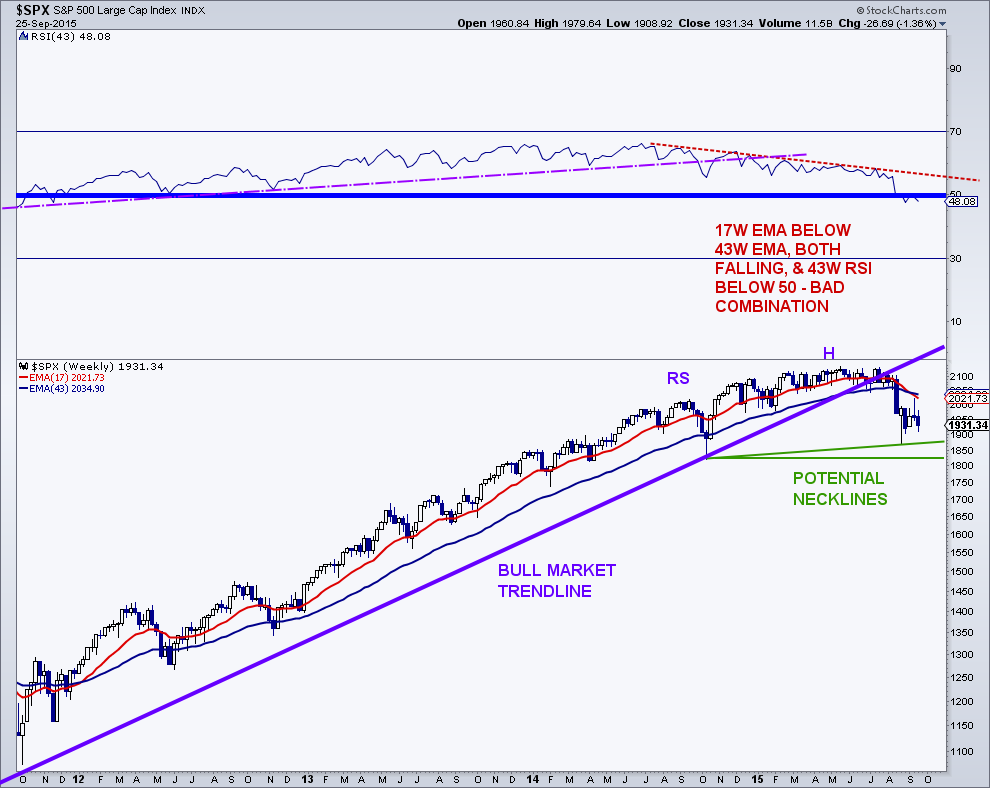
It’s also possible that the neckline of a large H&S is in place with the August low being the second point of the line, and we are now in the process of tracing out the right shoulder. Interestingly, that would mean that the larger stock market top is 285 points and would project down on a break to 1,565, which is extremely close to the 2007 bull market high.
Near term, and in an email update to subscribers Thursday, I was looking for a rally to the 1,950/1,960 once the 1,930 area and channel resistance was taken out. Well, we got that intraday Friday, followed by another weak close. If the bulls have any juice left, the next upside region of chart resistance lies up at 1,990. However, if the recent lows and those hit in early September near the 1,900 area give way first, it may be time to buckle your seat belts again as the August lows and then the October lows are in clear site.
Thanks for reading.
Twitter: @MarkArbeter
The author does not have a position in any mentioned securities at the time of publication. Any opinions expressed herein are solely those of the author, and do not in any way represent the views or opinions of any other person or entity.


