The bearish symmetrical triangle on the S&P 500 that I talked about a couple of weeks ago has morphed into a different shaped triangle called a bearish wedge. As I said before, triangles are continuation patterns of the prior trend meaning an eventual bearish resolution.
At this time, the index is sitting very close to the bottom of the bearish wedge, which sits near 1,955. So some market caution is warranted here.
A breakdown out of this triangle, which I expect, will have negative implications for price (and stocks). Most likely, the recent low at 1,867 will get taken out, and a trip to critical chart support at 1,820 or the October lows will be seen. This price action will all be part of a much larger top that the “500” may be tracing out.
However, there is still the chance that the S&P 500 rallies further into the rising triangle and eventually runs up to key chart resistance in the 2,040 region before the next major downleg begins. Besides chart resistance, the 50-day simple average also lies in the 2,040 area, and also represents key resistance on any rally. See the chart below.
S&P 500 Chart – Bearish Wedge Pattern
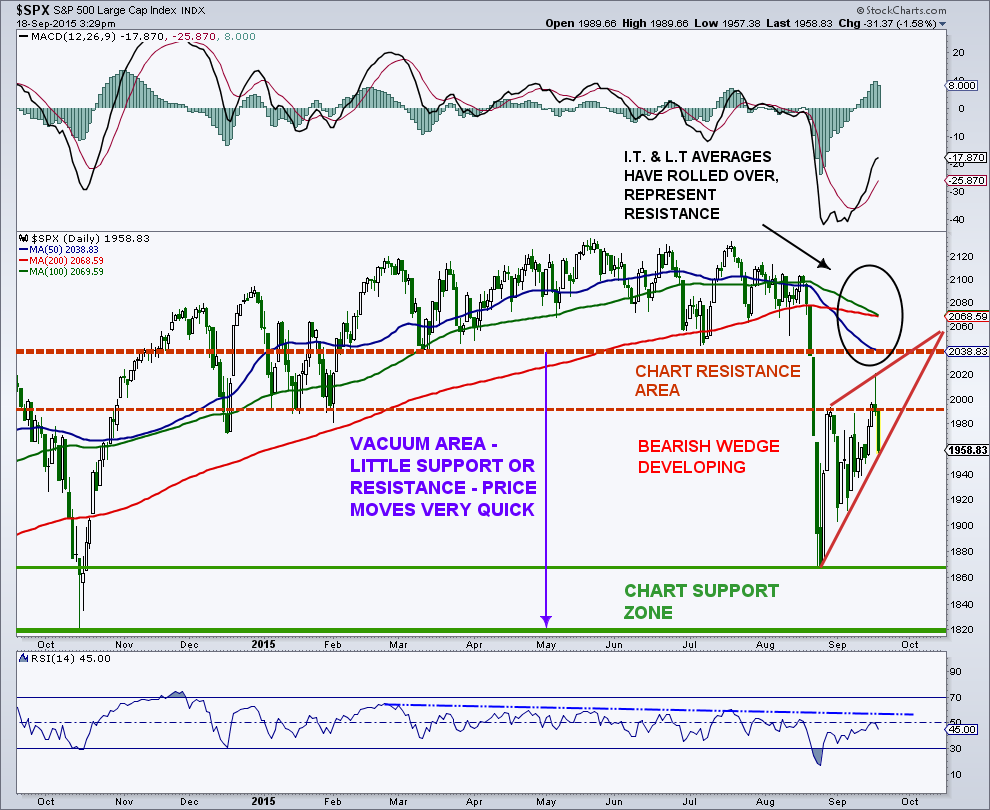
The rally before breakdown scenario has less probability, however, due to the nasty price reversal on FED day as well as the really nasty looking weekly candle on the S&P 500.
I will say that many, many sentiment indicators have lined up on the extreme panic side of the fence, suggesting the worst is over. Put/call ratios, volatility indexes, Commitment of Traders (COT) data, investment polls, etc. have all moved to extreme bearish levels, and when this happens, the contrarian in me takes note.
However, a more advanced read into market sentiment suggests that a market that ignores these extremes has clearly turned from bull to bear mode. So, reading sentiment may now take on a new set of rules. For instance, when sentiment reaches neutral from pessimistic, it will just be another sell signal. In one respect, this is a little similar to reading momentum in a bear market.
When momentum reaches neutral to overbought territory from oversold territory, that is a sell signal. So, unless the “500” stabilizes within the its newly formed range, and respects the August lows, things could get very ugly in the months ahead.
In the meantime, watch that bearish wedge pattern.
If any of you have an interest in my premium newsletter, please contact me at arbetermark@gmail.com. Thanks for reading and good luck in the week ahead.
Twitter: @MarkArbeter
The author does not have a position in any mentioned securities at the time of publication. Any opinions expressed herein are solely those of the author, and do not in any way represent the views or opinions of any other person or entity.


