S&P 500 Trading Outlook (2-3 Days): BULLISH… but upside limited
With the S&P 500 (INDEXSP:.INX) at/near key price resistance we could see a stalling out and trend reversal following the Thanksgiving holiday (likely next week).
The bottom line, upside price targets lie in the 2610-2615 range on S&P 500 Futures, just fractionally above current levels.
Any weakness in December which breaks last week’s lows (2557) would be thought to extend into mid-to-late December before a final push higher into year end.
S&P 500 Index Chart Spotlight
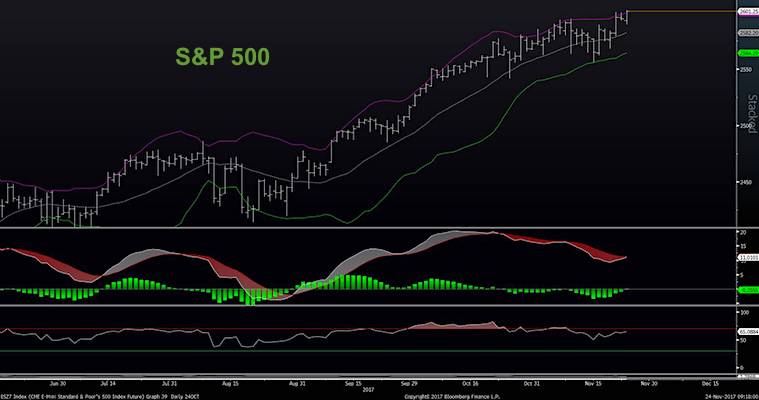
Technical Thoughts
Prices had a difficult time following through on Wednesday with just scant gains by the NASDAQ (INDEXNASDAQ:.IXIC) while both Dow Jones Industrial Average (INDEXDJX:.DJI) and S&P 500 finished mildly lower. While this time of year historically is quite positive on the day before and after the US Thanksgiving holiday, prices have already run up by over 1% in the last five trading days, and trading up at the high band of Bollinger Bands which have turned decidedly more sideways from prior uptrends.
U.S. treasuries have been largely sideways on the long end recently, however the persistent strength of 2 yearr yields has resulted in a pretty severe flattening in the yield curve. Commodity wise, Gold has been neutral, while Crude oil has vaulted upwards at a pretty sharp pace, breaking out to its highest daily close of the year yesterday, trading by Wednesday’s close at levels just shy of October and January intra-day highs. When looking abroad, most of Europe and Asia have followed suit to the US in bottoming and trying to rally. However, in the case of Europe, prices have not even recouped 50% of the prior decline from early November and failed to ultimately break out above May highs, so its worth reminding that Europe is in much weaker shape than the US.
Here are 5 things worth pointing out ahead of the weekend.
1) Despite the S&P having hit new highs, Financials, Industrials and Healthcare remain over 2% down from October highs.
2) Momentum and breadth remain well off November highs not to mention July or March of this year. Equity indices have had a sneaky tendency to rally back to new highs and make investors believe all is fine, when in reality, far fewer stocks are hitting new highs.
3) Small-caps and Mid-caps HAVE shown some decent recovery in the past couple weeks after both fell.
4) Signs of counter-trend exhaustion are close to forming by end of week in both Technology and in Consumer Discretionary, the only major groups still at new all-time high territory (which most other sectors are at least 2% or more below).
5) Dollar/Yen has begun a fairly rapid decline of late, and this flight to Yen is important to pay attention to, similar to the decline in High Yield ETF JNK.
Overall, stocks have rallied back to highs, yet problems are starting to resurface, given limited upside with the key drivers of this rally showing counter-trend signs of exhaustion and/or quite overbought. The charts below show very little upside when considering Bollinger Bands to the equation while momentum remains negatively sloped. Many have cast a blind eye to the problems and solely focusing on Tax reform, and the Santa rally, but this year might turn out much different than planned. Stay tuned.
If you are an institutional investor and have an interest in seeing timely intra-day market updates on my private twitter feed, please follow @NewtonAdvisors. Also, feel free to send me an email at info@newtonadvisor.com regarding how my Technical work can add alpha to your portfolio management process.
Twitter: @MarkNewtonCMT
Author has positions in mentioned securities at the time of publication. Any opinions expressed herein are solely those of the author, and do not in any way represent the views or opinions of any other person or entity.


