Weekly Stock Market Outlook December 2nd
Here’s a look at some key stock market indicators and emerging themes that we are watching in our research:
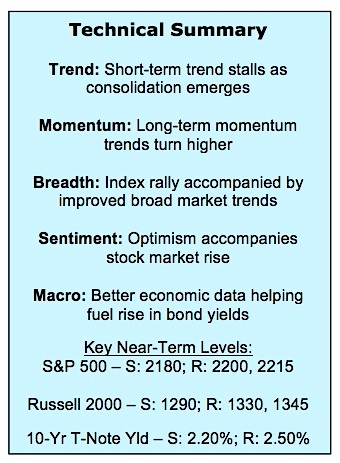
Post-Election Rally Stalls as Momentum Fades – The initial momentum surge that accompanied the post-election stock market rally has faded and the S&P 500 Index (INDEXSP:.INX) has slipped below its short-term trend for the first time since the Wednesday following Donald Trump’s surprise victory. Longer-term trend improvement continues to be seen, but stocks could be in for some further near-term consolidation.
With Stocks Overbought, Investors Turning Giddy – The persistent buying that accompanied the stock market rally to new highs has left stocks overbought and over-believed. A period of consolidation could help quickly relieve the overbought condition. Without some relief, the recent surge in optimism (especially at a time when interest rates are rising) could hamper further rally attempts.
December Seasonal Strength Not a Straight-Up Affair – December has a well-established reputation as being bullish for stocks (stock market declines each of the past two Decembers notwithstanding). Often overlooked however, is the tendency for the first half of the month to be frustratingly choppy, with all the net gains coming in the second half.
Stock Market Indicators
S&P 500 Index
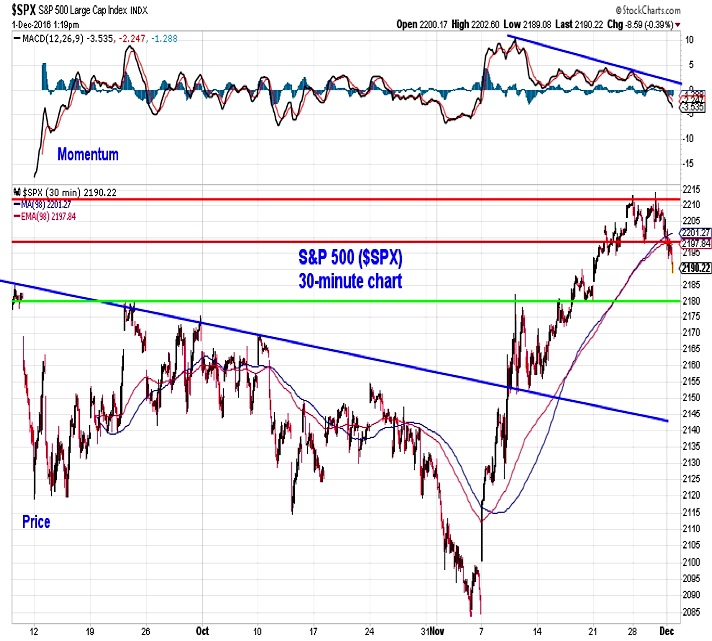
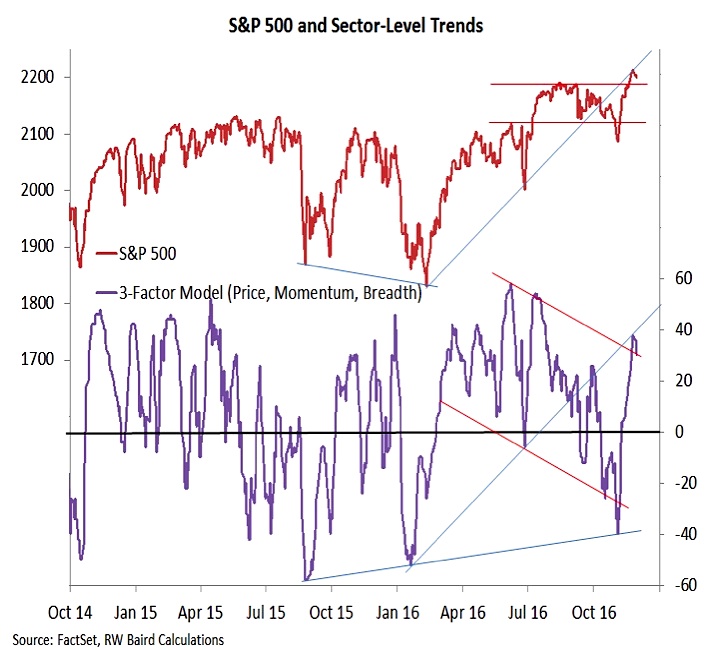
The short-term chart of the S&P 500 shows that momentum has faded since the initial surge that accompanied the post-election rally. Given the size of the move on the S&P 500 (6% over the course of three weeks), some near-term consolidation would help position stocks for a more sustainable trend higher moving into 2017. In terms of near-term support, 2180 could be an important level.
Importantly, longer-term price and momentum trends have continued to improve and support an eventual resumption of this move higher.
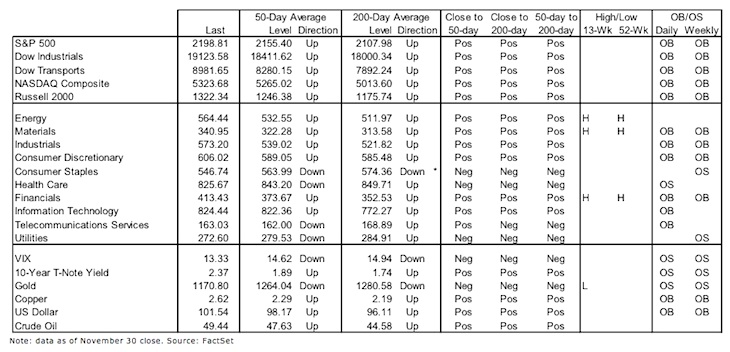
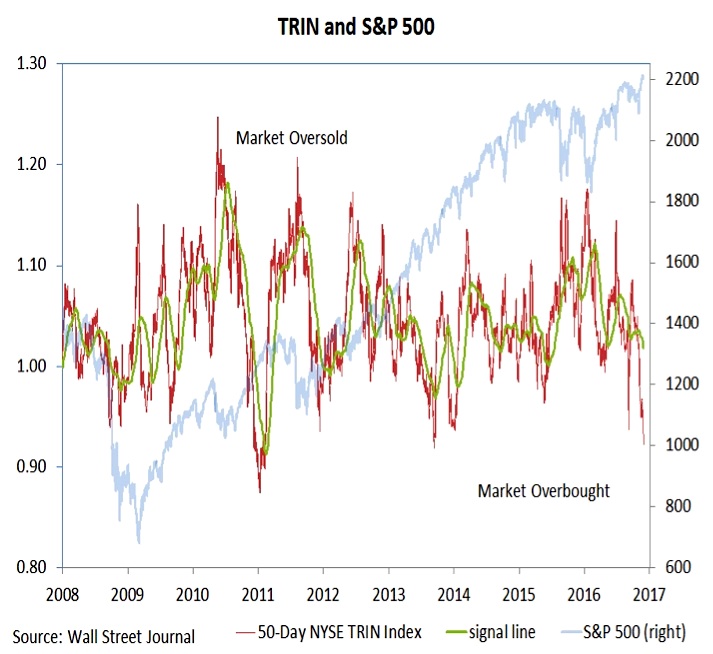
The table on the front page confirms the message from the TRIN index – the November rally has resulted in widespread overbought conditions at the index-level, sector-level and the stock market overall. In the context of an emerging up-trend, overbought conditions can lead to pauses that refresh rather than signaling the risk of a significant reversal. In the current situation, it suggests a more favorable near-term risk/reward could emerge after a period of consolidation.
Adding to the reasons for some near-term caution is our sector-level trend indicator. Sector-level trends have improved dramatically over the past month, but have not definitively broken higher. Given the scope of the recent gains, some consolidation here is also likely. Again, that could provide a more stable foundation from which to build the next leg of the rally.
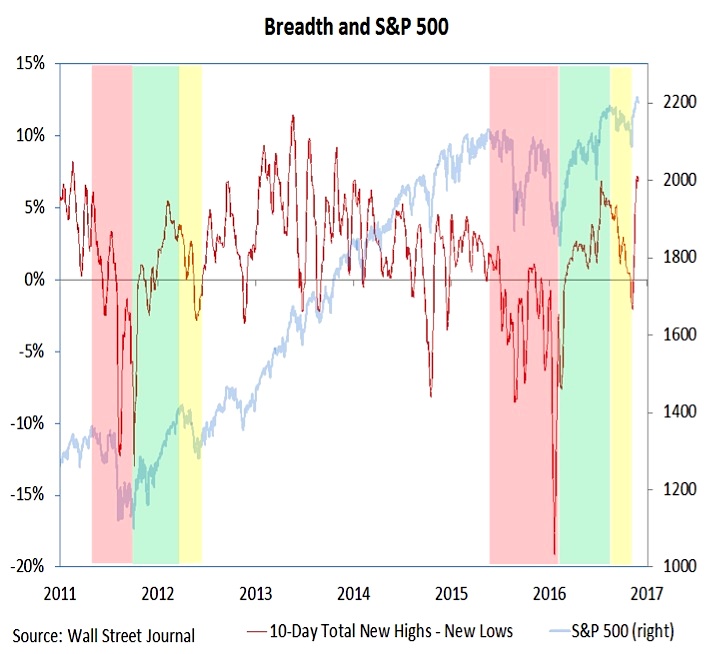
The new highs seen at the index and sector-level have been echoed at the issue level. Our net new high indicator for the NYSE+NASDAQ has been following the pattern established following the 2011 cyclical bear market. The recent surge to a new high by this indicator is further evidence that the cyclical consolidation has run its course, and the longer-term trend is higher into 2017 (once some of the near-term headwinds addressed in this piece dissipate).
continue reading on the next page…


