In this investing research note, we will analyze key stock market indicators, consider the current trend of the S&P 500 Index (INDEXSP:.INX), and discuss emerging themes that we are watching in our investing research.
Here’s a summary of the highlights:
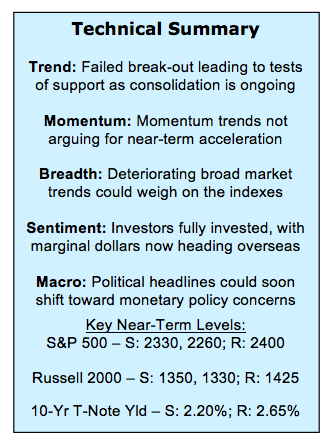
Breadth Deteriorating as S&P 500 Moves Toward Support – The S&P 500 has been unable to sustain the tentative breakout above 2400. While new highs are a mark of strength, in this case the move came as trends at the individual stock level have been deteriorating. This may mean the S&P 500 may be in for further consolidation prior to a sustained move higher.
NASDAQ Overextended, While Stocks Overall Lack Leadership – The NASDAQ Composite (INDEXNASDAQ:.IXIC) has been the clear leader among U.S. indexes this year, but its gains have come with narrowing participation, suggesting it too has been ripe for a pullback. More broadly, the typical leadership groups have not joined the indexes in making new highs, suggesting rally attempts in the near term could falter.
Copper Continues to Consolidate but Bond Yields Break Support – Looking beyond stocks, we are watching both copper prices and bond yields closely. Copper continues to consolidate following a break of the long-term down-trend, while the spate of weaker-than-expected data and increased political uncertainty has increased demand for bonds and pushed yields lower.
Equity Market Sentiment Indicators
S&P 500 Index
Political uncertainty this week allowed stocks to wake from their slumber and experience some historically normal volatility. Whether it is a one-off event or the return to a more normal environment remains to be seen. Following a tentative break above resistance near 2400, the S&P 500 has broken below 2380 (which has provided support for the past month) and could be on its way toward support near 2330. Looking farther out, the S&P 500 may be overdue for a 5% correction (the last such decline was over 200 days ago, the longest stretch since 1996). That would bring the trend-line off of last year’s lows and also the 200-day average (near 2260) into play.
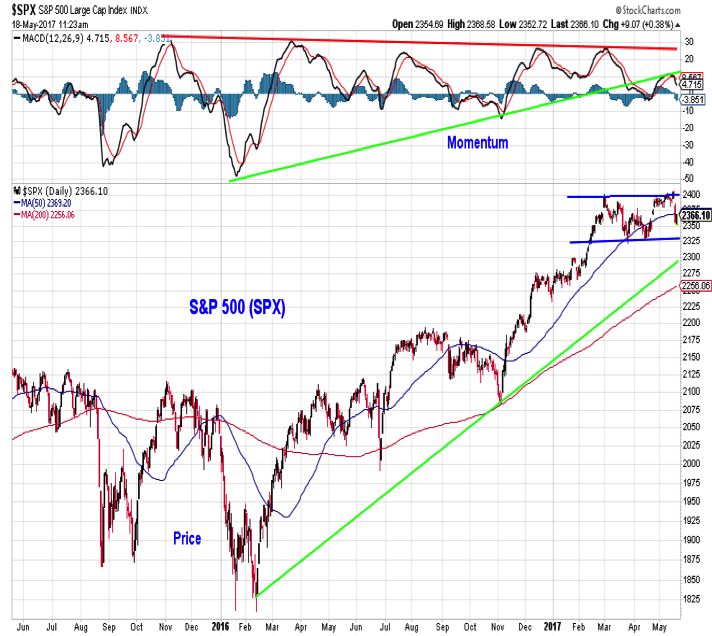
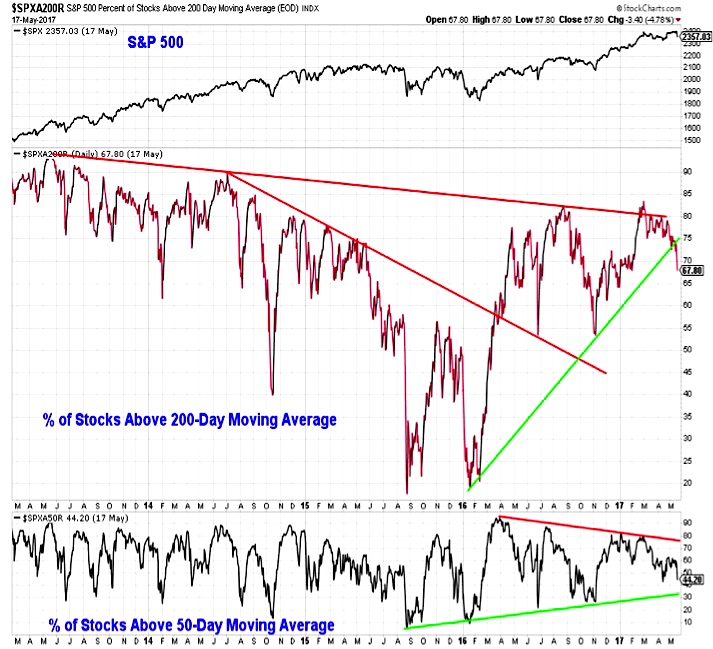
While the S&P 500 has been in consolidation mode, breadth has been deteriorating, and this may mean the index needs to work lower prior to seeing a sustained rally. We had hoped to see the percentage of stocks above their 200-day averages remain elevated while the percentage of those above their 50-day averages got washed out. The opposite has occurred. Longer-term trends have deteriorated without near-term trends getting oversold. At this point we need to see sustained improvement in these trends (even if from slightly lower levels) to gain confidence that the S&P 500 has sufficient underlying support to sustain a rally.
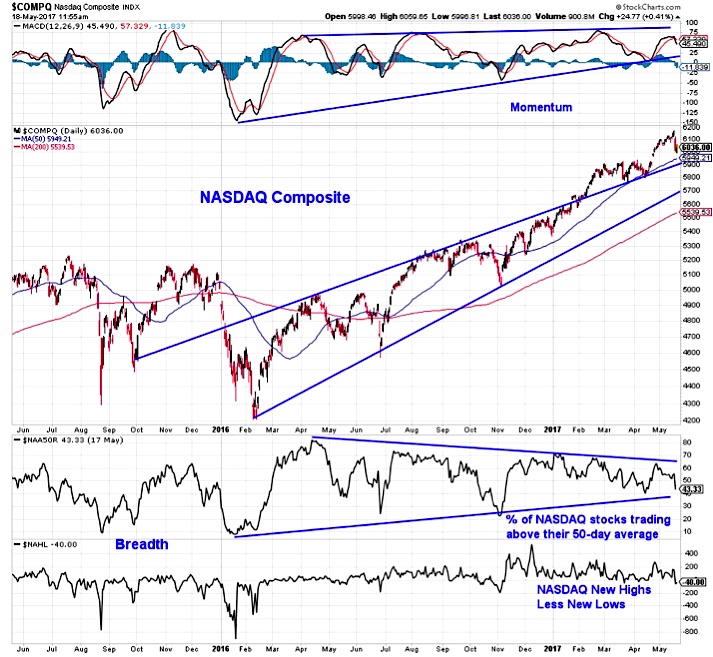
Nasdaq
The tensions between the index and the underlying stocks that are present for the S&P 500 are even more pronounced for the NASDAQ Composite. The NASDAQ has been a leader this year, and while other indexes have moved sideways, it has rallied to new all-time highs with improving momentum. Breadth, however, has not kept pace. The percentage of NASDAQ stocks trading above their 50-day averages has deteriorated since the beginning of the year and the new high list has narrowed.
continue reading on the next page…


