The Morning Report: S&P 500 Futures Continue To Flirt With Lower Support
The markets are down again this morning after a sharp rally into resistance after hours and in the overnight. But S&P 500 futures prices are pushing for mixed action.
Futures traders moved in to test and breach yesterday’s resistance at the 2014.5 regions – and settled into familiar territory of 2017 before reversing. Momentum is negative, but still mixed across timeframes – suggesting buyers will recover at support and sellers will show strength at resistance.
This morning at 6:25am eastern, we sit clearly at the support zones of consequence from yesterday once more and are struggling to maintain strength to hold the region. Breaking and holding below 1991 will lead to a lower congestion area nearby, as it did yesterday as well.
Intraday resistance sits near 2017.25. Intraday support sits at 1991. Breaks of either support or resistance must be confirmed on tighter time frames (30min/1hr) for trending trades on the day to hold. We have a bearish momentum formation in the shorter cycles and time frames of the charts that suggest bounces into resistance regions should continue to be sold.
Shorter time frame momentum indicators are negative, but higher than Monday. Longer cycles are upward trending and drifting into neutral territory.
See today’s economic calendar with a rundown of releases.
RANGE OF TUESDAY’S MOTION
Crude Oil Futures (CL_F)
Crude Oil prices have been trapped in a trading range for several days. This range appears to be between 36.4 and 38.3 – with breaches on either side that have not held. Strong support still looks like 36.4. Momentum is increasingly bearish across time frames, and traders seem willing to trade the ranges waiting for volume to punch the move in either direction. The bigger picture still suggests a basing formation, but the EIA reports continue to consistently show builds in inventory.
Moving averages, though still clearly negative on longer time frames, suggest that the chart may be trying to develop more bullish activity, but momentum is negative. With mixed motion like this, it is very likely that breach in either direction will be retraced. Because the chart is caught in a range, we are essentially looking at the same setups. Intraday trade setup suggests a long off 37.25 into 37.48, 37.8, 38.3 and perhaps 38.53 – even more if the buyers take over on volume at the breach of the level – see the blog for levels above that region. Below a 36.5 failed retest or a rejection of the 38.3 area sends us to 37.85, 37.4, 37.05, 36.87, 36.6 and 36.03 to 35.7 – below that and we likely see new lows. Momentum on longer time frames is mixed.
E-mini S&P 500 Futures (ES_F)
Below is a new chart with active S&P 500 futures price support and resistance trading levels. Click to enlarge.
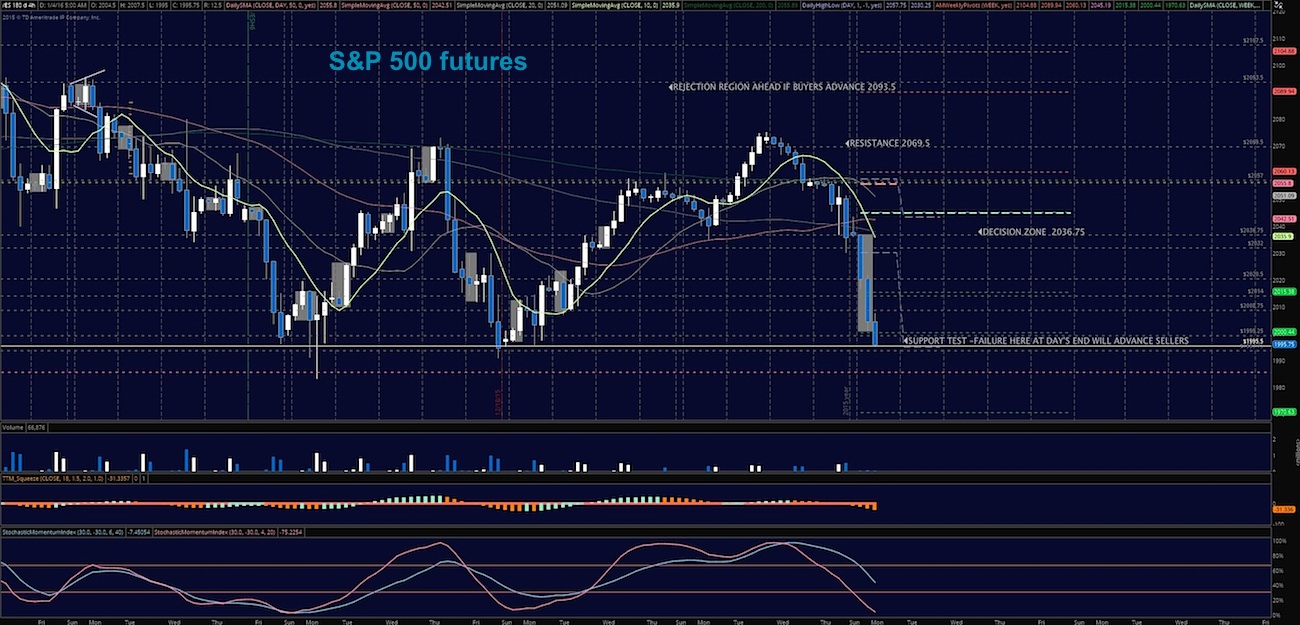
Aggressive upside motion is best setup on the breach of 1998– or a bounce off 1991 (as long as momentum is holding). Targets near 2000.5, 2003.5, 2007.75, 2012, 2014.5 and 2017- watch 2007-2008 for sellers to try to reverse the trend of the bounce. The hold of the 2014.5 region will likely advance buyers and bring more upside into resistance above at 2017, 2020, 2023.5, 2026.25, 2029.75, 2031.5 and 2034.25. Long trades are counter trending at this writing but pullbacks into higher lows may reverse the intraday trend.
Downside motion opens below the failed retest of 2000 (with negative momentum-this would look counter trend in tight time frames), or at the failure to hold 1992 opens the short. Retracement into lower levels from 1992 gives us the targets at 1990.25, 1985, 1982.5, 1980.25, 1978.75, 1975.75 and perhaps 1970.75.
Short action intraday is trending currently unless we have a bounce and positive retest of 2004.5 with momentum shifts.
If you’re interested in the live trading room, it is now primarily futures content, though we do track heavily traded stocks and their likely daily trajectories as well – we begin at 9am with a morning report and likely chart movements along with trade setups for the day.
Visit The Trading Vault to learn how to trade the way I do. As long as the trader keeps himself aware of support and resistance levels, risk can be very adequately managed to play in either direction as bottom picking remains a behavior pattern that is developing with value buyers and speculative traders.
Thanks for reading.
Twitter: @AnneMarieTrades
The author trades futures every day and may have a position in mentioned securities at the time of publication. Any opinions expressed herein are solely those of the author, and do not in any way represent the views or opinions of any other person or entity.


