The stock market declined last week, with the S&P 500 (SPX) falling 111 points from 2873 to 2762.
The coming weeks should see more volatility and lower prices. But for now, the stock market is set up for a brief bounce.
S&P 500 Analysis and Market Cycle Outlook:
- The S&P 500 moved lower last week, declining by 3.7%.
- The cost of doing business increased in January, with wage growth increasing by 2.9%, which is the strongest performance since in eight years.
- Our projection for stocks this week is for a possible bounce and then for increased downside pressure to resume.
S&P 500 Chart with Market Cycle Overlay
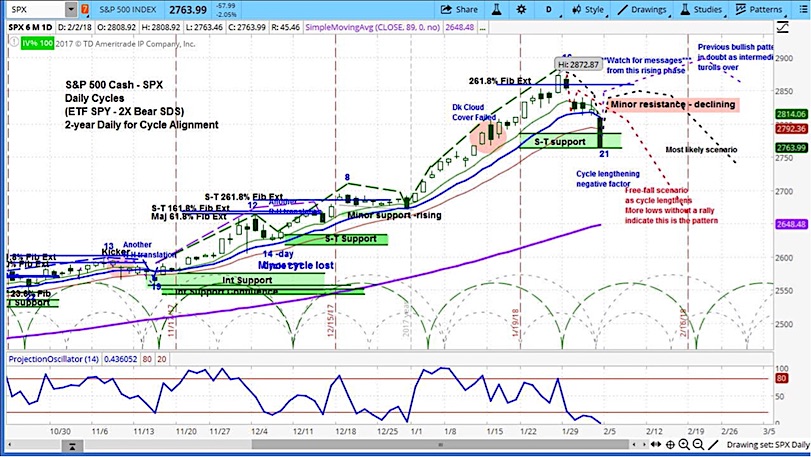
The week began by moving off of its all time high, after it was reported that Apple (AAPL) had informed its suppliers that it planned to cut its iPhone X production target for Q1.
Meanwhile, 30-year bonds lost a point on Monday over concerns that the Treasury Department may increase the amount of the bonds it will sell, pushing supply higher.
On Tuesday, the Health Care Sector ETF (XLV) was down 2.1%, after Berkshire Hathaway (BRK) CEO Warren Buffett indicated he viewed the sector as a “hungry tapeworm”.
Buffett also announced that Berkshire would participate in a consortium with Amazon (AMZN) and JP Morgan Chase (JPM) to provide health care services to their employees.
Also on Tuesday, new data from the Case-Shiller Home Price Index indicated a 6.2% rise in home prices nationally.
On Wednesday, ADP/Moody’s Analytics released their estimate for private sector payrolls, which grew by 234,000 in January, compared to the market’s expectation of 185,000.
In other news, Janet Yellen chaired her final Federal Reserve meeting, with the policy committee voting to keep interest rates unchanged.
However, their statement may have set the table for an increase at its next meeting, noting that “labor market has continued to strengthen and economic activity has been rising at a solid rate.”
On Thursday, there were new indications that the annual liquidity crisis that precedes the Lunar New Year in China may be worse this year.
On Friday, the Labor Department announced that 200,000 jobs were created in January, which exceeds the 180,000 expected, with the unemployment rate at 4.1%
As well, wage growth increased by 2.9% over the trailing twelve months, which is the strongest performance since June 2009.
Thus, the job market is getting tighter and workers are getting more expensive. The S&P 500 (SPX) fell hard on this news, ending the week by shedding 60 points on the day, or 2.1%.
Also contributing to the sell off may have been the release of a memo drafted by Republicans on the House Intelligence Committee. This could lead to greater uncertainty about whether the investigation on Russian interference in the 2016 elections will be allowed to proceed.
The daily chart above shows our projection for the SPX in the coming week: a small bounce and then a move lower, if not starting this week then the next.
Each Friday, we host the askSlim Market Week, during which we present what happened in the preceding week and what might happen in the coming week.
In last Friday’s episode, I outline three possible scenarios for what could follow Friday’s dramatic market action, based on the market cycles. Check it out in the link below.
https://www.youtube.com/watch?v=SpUJGNyr9Dk
Twitter: @askslim
Any opinions expressed herein are solely those of the author, and do not in any way represent the views or opinions of any other person or entity.


