We are going to look at the S&P 500 today using monthly and weekly charts.
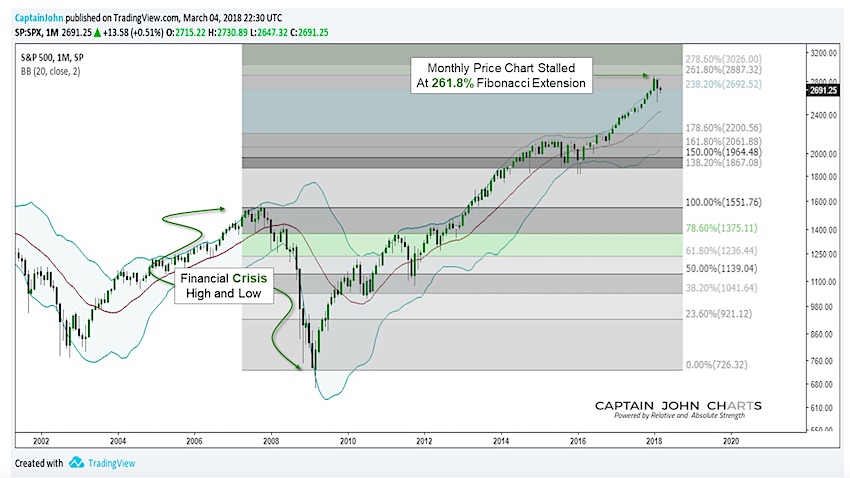
First is a look at S&P 500 using Fibonacci analysis; in particular, we will look at the Fibonacci Extension from the 2007 highs to the 2009 lows.
Notice how the rally stopped right at the 261.8% Fib target and began to pull back below the upper Bollinger Band.
It is not unusual for price to test the red 20 month moving average which is located at this time around the low 2400’s.
S&P 500 “Monthly” Bar Chart
Here is another look at the S&P 500, this time on a weekly chart, which utilizes what’s known as Andrew’s Pitchfork.
The pitchfork utilizes 3 lines. The first is called the median line and is created by drawing a line between two points that identify the trend. In this case, we used the 1987 crash low as out starting point and moved out in time to the 2016 lows. Lines 2 and 3 are then added equally distant and parallel to the median line and identifying a high and low, in this case the 2007 high and 2009 low. The lines tend to act as support and resistance.
Notice how the S&P 500 has crossed below a 4th line located halfway between the median and upper channel breaking support.
Please note: The median line is currently located in the low 2300’s
S&P 500 “Weekly” Chart w/ Andrew’s Pitchfork
If you are interested in learning more about our investing approach and financial services, visit us at CaptainJohnCharts.
Twitter: @CptJohnCharts & @FortunaEquitis
The author may have a position in mentioned securities at the time of publication. Any opinions expressed herein are solely those of the author, and do not in any way represent the views or opinions of any other person or entity.


 Flirting With Critical Support… Again")

