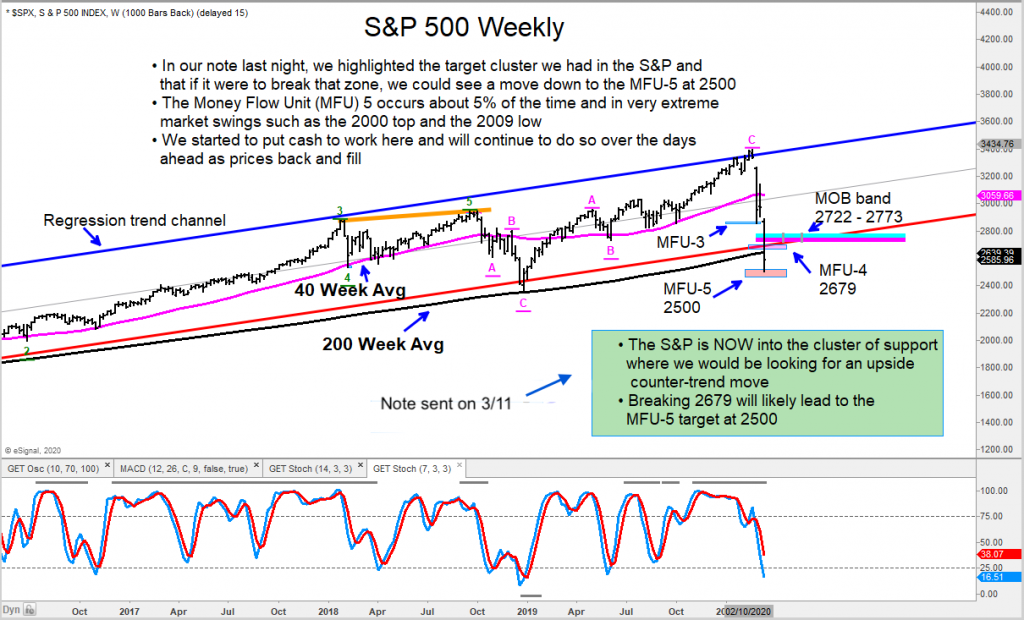
S&P 500 Index “weekly” Chart
I am starting to put some cash back to work as the S&P 500 Index undercut our MFU-5 price target at 2500. This extreme target came into play after our MFU-4 target (2679) was broken.
There is no guarantee that this will mark “THE” low, but back in 2009, the S&P 500 undercut our MFU-5 price target by just 3%.
At that time, the target was 705, and we had a closing low of 683 based off the weekly chart. The price target was generated from the Q4 2007 top.
In the coming days (or perhaps weeks should we stabilize soon), we will be in a better position to get a clearer view of the potential of a good trading low or something more substantial. And at what price level.
It is important to recognize that this is a market in panic, so all investors should have a carefully thought out plan.
The author may have a position in mentioned securities at the time of publication. Any opinions expressed herein are solely those of the author, and do not in any way represent the views or opinions of any other person or entity.

: Showing Some Signs of Emerging Strength")

