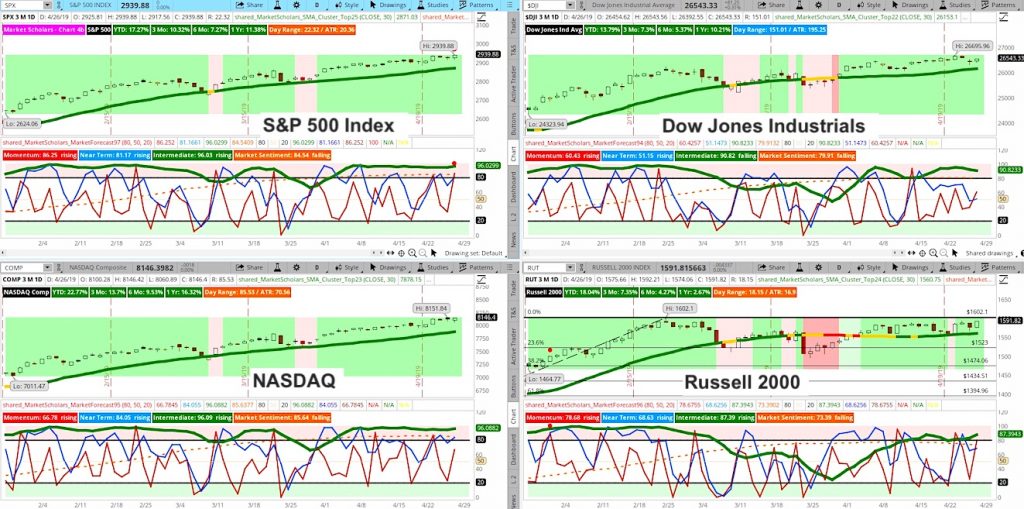
For the first time during this intermediate run, the S&P 500 formed a quadruple overbought cluster on its Market Forecast study – all four lines above the 80th percentile, including long-term Market Sentiment (orange line in chart below).
This is the first time we’ve seen this signal this late in an intermediate cycle (and not at the beginning like normal) since early 2017.
Both the weekly and monthly near-term lines are showing strong highs on their respective Market Forecast charts. The Russell 2000 came close to forming an overbought cluster but it’s still not anywhere close to trading at a new all-time closing high, like the S&P 500. In fact, the small-cap index is still below its February highs.
The Russell 2000 broke above some recent highs (after its large-cap counterparts already had previously) but still sits below its late February highs and shows a weaker bullish posture than the other major indexes.
This week marks the 16th week for the current bullish trend on the Heikin Ashi candlestick charts. The typical bullish intermediate run lasts 3 months. But, this week’s candle is strongly bullish and next week’s candle will at worst be a transition candle.
The MACD has been fluctuating between red and green arrows for the past couple of weeks as momentum remains positive but is stalling. Buyers still easily in control according to Stochastic indicator.
The S&P formed a new 4-week high and reached its 5% bound during bullish runs – but, next week, the range should shrink considerably as the market heads towards its long-awaited intermediate pullback.
Subscribe to the Market Outlook daily email list to get the daily and weekly overbought and oversold Market Forecast clusters watchlists for the S&P 500.
Weekend Market Outlook Video – Week of April 29:
Below are some additional bullet points discussed in this weekend’s video:
- Volatility is not confirming this week’s new high. In fact, this month’s extremely small range in $VIX suggests that next month we may start seeing an increase in volatility to get the range back up to its average levels.
- Crude oil started the week very strong but finished with a long upper shadow on its weekly chart. Considering crude has a very strong correlation with U.S. equities right now, this is another red flag that weakness may be forthcoming in stocks.
- Considering the many red flags on the current bullish run, this does not mean to not make any bullish trades. The suggestion is to consider the increasing risk factors on the bullish trend and avoid a “pain trade” to the downside by keeping position sizes smaller and accounts more delta neutral.
- The U.S. dollar may be showing a “fakeout” move above $98 considering the bearish trend on long-term yields and the weak macro environment in the U.S. – the strong GDP print notwithstanding. The Q1 GDP report was largely driven by temporary factors, like trade and inventories and inflation adjusters.
- Sector correlations are falling with fewer sectors driving the continuation of the bullish trend higher and more sectors showing their own intermediate pullbacks.
- The Rate of Change for $SPX on a 3-month basis is coming down from an extreme and remains at high levels that have shown to precede periods of volatility previously.
- Bearish trade example in Materials sector that reflects the stock market may not be showing the same economic growth expectations that the GDP print may suggest.
Twitter: @davidsettle42 and @Market_Scholars
Any opinions expressed herein are solely those of the author, and do not in any way represent the views or opinions of any other person or entity.

: Worrisome to Broader Market?")
