Friday, the S&P 500 (SPY) broke an important support level by closing under the 50-Day moving average and this week’s low.
While this was an important level to break it was also a very clean and obvious place for the SPY to fall through.
For the past 6 trading days, we’ve seen large daily ranges showing increased volatility and a fierce battle between bulls and bears. For most of those days, the market was neither pushing higher nor completely breaking down.
However, Friday was the straw that broke the markets back.
Friday the S&P 500 Index ETF (SPY) broke the low of 9/14 at $443.22 and the 50-DMA at $442.73.
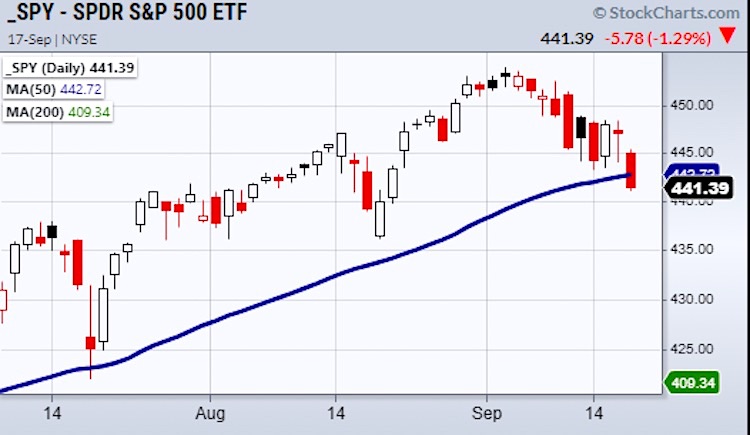
Because these prices were close to each other and obvious support levels these areas could have been targeted by institutions looking to load up on shares.
An example of targeted support or stops can be seen when a big support level is hit, followed by a quick reversal.
While this is very frustrating price action to trade, investors should know that market makers and large institutions often search for these areas.
They look for obvious price levels where people will place their stops and try to push the market towards those prices.
Hitting these stop areas is a great way for large institutions to accumulate stock at a better price.
With that said, this past week of trading has been very sloppy and while Friday’s clean break could be setting up a reversal for Monday, we should stay very cautious as we don’t want to buy a falling knife.
Therefore, if the market is looking to turn around Monday or later in the week, watch SPY’s price to clear back over the 50-DMA and over the low of 9/14 at $443.22.
Check out my video “Following The Money” below. I do something a little different by taking you through the top Renaissance Capital holdings that are heavy in the tech space. I take a deep dive to see if there are any strategic moves to make while the market is extremely tough.
Following the Money: The Top IPO Tickers | Mish Schneider
Stock Market ETFs Trading Analysis & Summary:
S&P 500 (SPY) Needs to get back over 443.22
Russell 2000 (IWM) Held the 50-DMA at 221.30.
Dow Jones Industrial Average (DIA) Like this to get back over 347.31 area.
Nasdaq 100 (QQQ) Next support the 369.63.
KRE (Regional Banks) Dojo day. 63.55 support area.
SMH (Semiconductors) 263.86 support.
IYT (Transportation) Like this to hold over 245.48.
IBB (Biotechnology) 168.89 support from the 50-DMA.
XRT (Retail) tested 50-DMA at 95.06
Twitter: @marketminute
The author may have a position in mentioned securities at the time of publication. Any opinions expressed herein are solely those of the author and do not represent the views or opinions of any other person or entity.


