Harder Markets And Easier Markets
Regular viewers of CCM’s weekly videos are familiar with the expressions regarding the stock market:
“The longer a market goes sideways, the bigger the move we can expect to get when price breaks from the consolidation pattern.”
“Harder markets are typically followed by easier markets.”
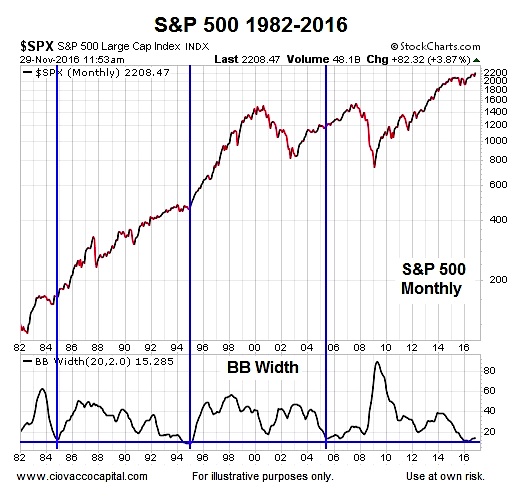
2016: Very Rare Bollinger Band Width On S&P 500 Index
Bollinger bands are based on the same basic concepts. From StockCharts.com:
The upper and lower bands are based on the standard deviation, which is a measure of volatility. The bands narrow as price flattens or moves within a relatively narrow range. The theory is that periods of low volatility are followed by periods of high volatility. Relatively narrow BandWidth (a.k.a. the Squeeze) can foreshadow a significant advance or decline.
In the monthly S&P 500 (INDEXSP:.INX) chart below (1982-2016), notice how the Bollinger Band Width has only reached present day levels on three other occasions (1984, 1995, and 2005). In each case, the S&P 500 consolidated (low volatility) and then broke out of the consolidation box (higher volatility). Since a picture is worth a thousand words, it may be helpful to view a larger version of the stock market chart below.
1993-1995 Case
A zoomed-in view of the 1995 case, shows the S&P 500 traded in an indecisive consolidation box for roughly two years. The consolidation period coincided with a low and rare Bollinger Band Width reading.
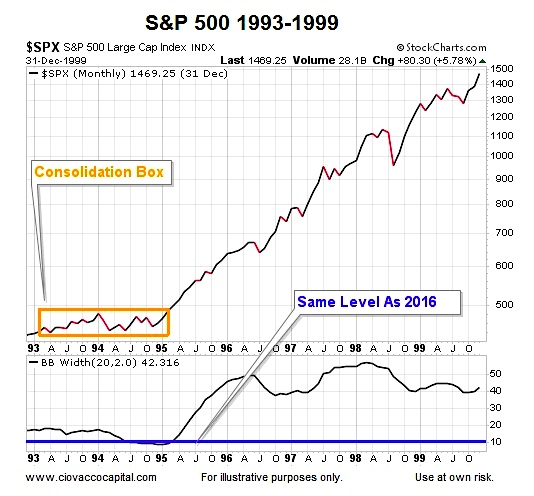
The 1993-1995 period also contains some similarities to the present day in the form of interest rates, a strengthening U.S. dollar, and a rare weekly moving average set-up, as shown in this video clip.
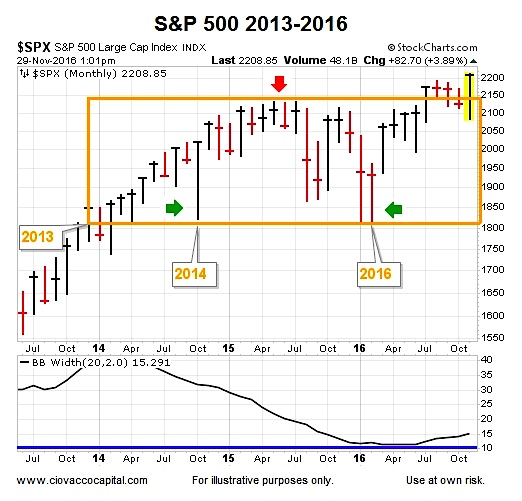
2013-2016 Case
In the present day, similar to 1993-1995, the S&P 500 has been in an indecisive consolidation box. However, instead of going sideways for roughly two years, the present day consolidation box was in play for roughly three years.
2016 Will Follow Its Own Script
Is 2016 radically different than 1995 in many ways? Yes, just as 1995 was radically different than 1984, and 2005 was radically different than 1995. The low Bollinger Band Width reading has occurred in four significantly different periods (1984, 1995, 2005, and 2016).
How Can All This Help Us?
The purpose is not to predict the outcome in 2016, but rather to help us keep an open mind about better than expected outcomes, especially relative to the frustrating and short-lived trends of the past three years. The charts above simply review the history of low / rare Bollinger Band Width readings; nothing more, nothing less. It should be noted we are reviewing a very small sample size.
If 2016 and 2017 fall into the bullish camp, the major U.S. stock market indexes will remain above their recent long-term consolidation boxes, asset class behavior will continue to align with risk-on outcomes, and the current bullish trends will remain in place. If the bears start to work on the previous list, the odds of “bad things happening” will improve. Time will tell.
Thanks for reading.
Twitter: @CiovaccoCapital
The author or his clients may hold positions in mentioned securities at the time of publication. Any opinions expressed herein are solely those of the author, and do not in any way represent the views or opinions of any other person or entity.
: Showing Some Signs of Emerging Strength")


: Showing Some Signs of Emerging Strength")