This swift global equity market decline sparked by the coronavirus outbreak has put many markets in a weak position.
In the U.S., the Russell 2000 Index, Mid-Cap Index, and Dow Transportation Index come to mind. They are all trading below long-term trend support.
Today’s charts and analysis focuses on the S&P 500 Index, a broad U.S. stock market barometer.
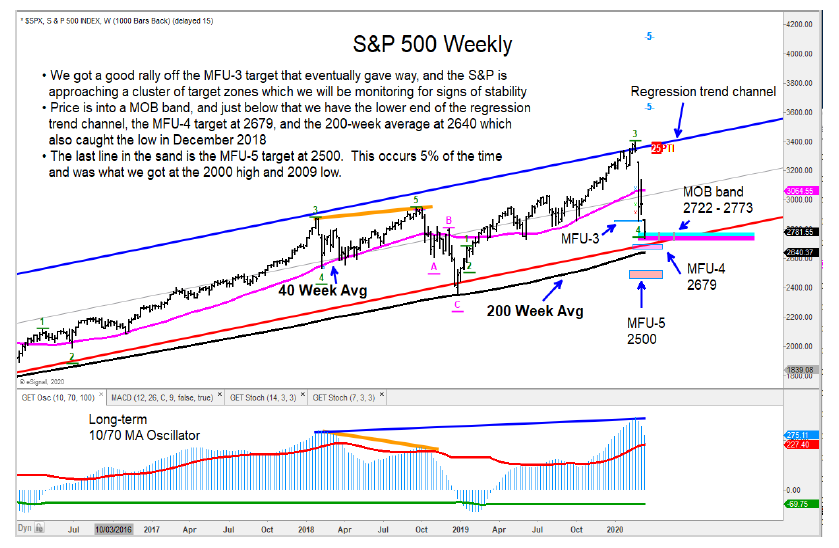
Below I highlight 3 potential support areas for the S&P 500 Index.
As you can see, there is a band of support between 2722-2773. Below that is our MFU-4 (money flow unit) support at 2679. That is followed by our extreme MFU-5 support at 2500.
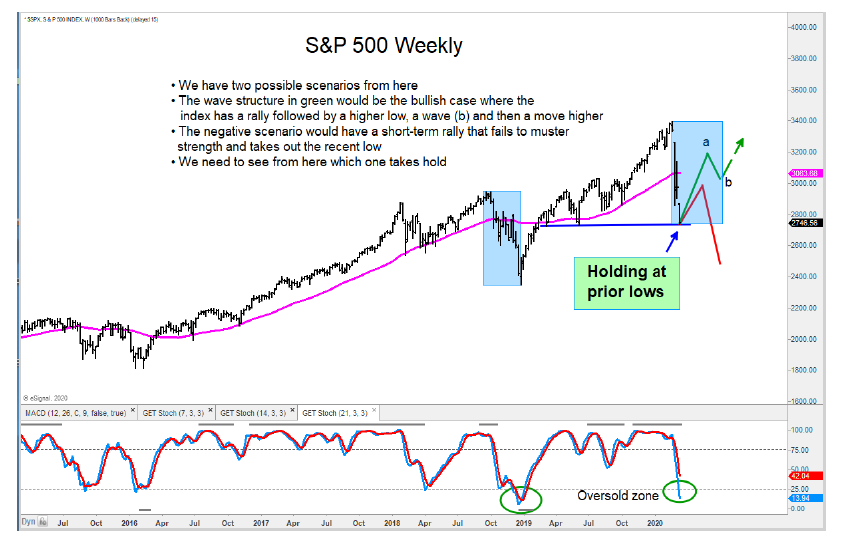
Further below, you can see two scenarios/outcomes (bullish and bearish) that may occur after the market finds a low and bounces.
Things should become clearer in the days ahead.
S&P 500 Index Chart – Price Support Targets
S&P 500 Index Chart – Two Scenarios
The author may have a position in mentioned securities at the time of publication. Any opinions expressed herein are solely those of the author, and do not in any way represent the views or opinions of any other person or entity.
: Creating Bullish Divergence?")

 and Semiconductors (SMH): Concerning Price Pattern?")
 and Semiconductors (SMH): Concerning Price Pattern?")


