S&P 500 Index “Hourly” Trading Chart Analysis – December 5, 2019
S&P 500 Index Trading Outlook (3-5 Days): Bearish
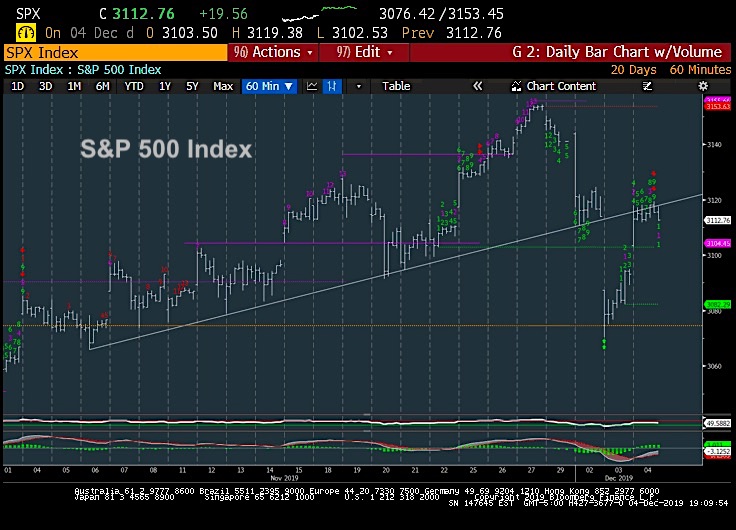
I am staying negative on the broader stock market (S&P 500 Index) until 3132 is exceeded.
As long as that does not occur, I am expecting a pullback to 3027 and below that to 2985-90 before year-end rally.
It’s still too early to make too much of this bounce/rally.
The S&P 500 has regained about 50% of the prior 89 point decline from early Monday morning into Tuesday morning. However, based on hourly trends, this move does NOT look to be something that should move back to new highs right away.
The move looks corrective in nature, and it still looks right to bet on a retest of lows in the upcoming week(S) before a rally into year-end. Daily closes over 3132 would warrant stopping out shorts, with warning signs over 3124 in S&P Futures for those who wish a tighter leash.
For now, this is looked upon as an ABC type corrective move and A and B are nearly complete, which should lead to a final C wave down to test/undercut lows ahead of a year-end rally.
If you have an interest in seeing timely intra-day market updates on my private twitter feed, please follow @NewtonAdvisors. Also, feel free to send me an email at info@newtonadvisor.com regarding how my Technical work can add alpha to your portfolio management process.
Twitter: @MarkNewtonCMT
Author has positions in mentioned securities at the time of publication. Any opinions expressed herein are solely those of the author, and do not in any way represent the views or opinions of any other person or entity.


