Most of my trading career and mentoring life has been focused on using my unique fibonacci techniques.
Over the years, I have shared several insights and article here on See It Market.
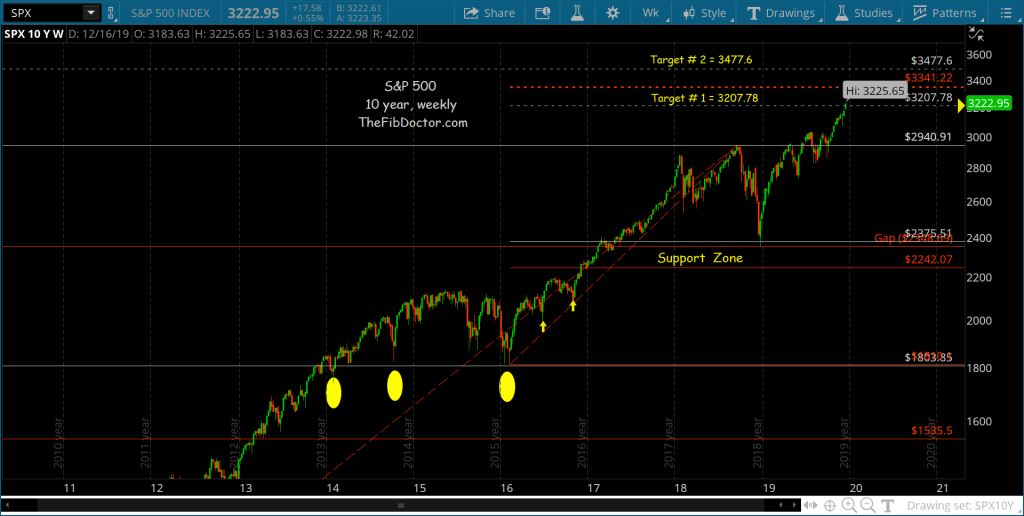
Today, we revisit the S&P 500 Index and our Fibonacci price targets.
As you can see in the chart below, our first Fibonacci price target has been met at 3207.78.
This was first predicted here: S&P 500 Fibonacci Analysis With Short and Long Term Targets
I still maintain my 2nd price target (longer term) of 3477.60 on the S&P 500. Please reach out with questions and good luck out there!
Twitter: @TheFibDoctor
The author may have positions in mentioned securities at the time of publication. Any opinions expressed herein are solely those of the author, and do not in any way represent the views or opinions of any other person or entity.


