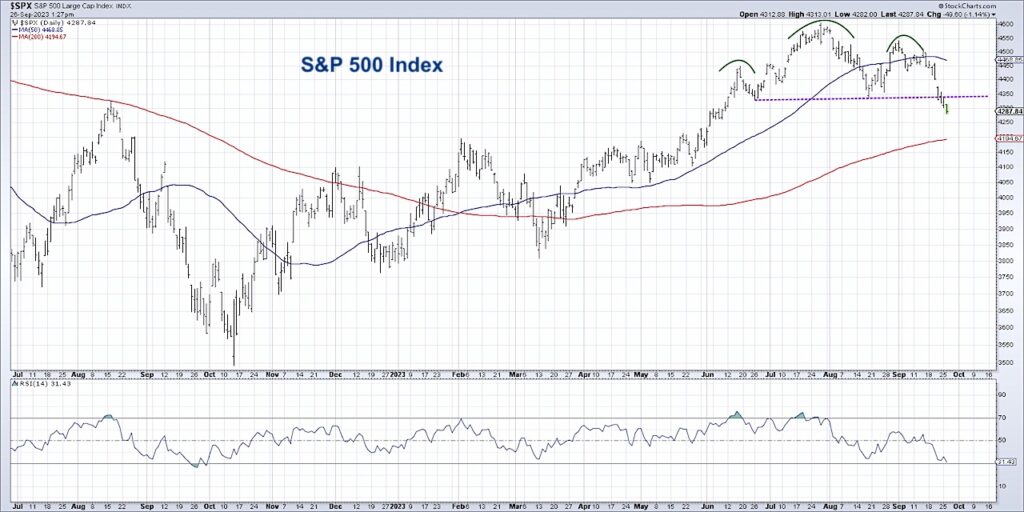
The S&P 500 index has now confirmed a head and shoulders topping pattern, indicating a broad rotation from a bullish phase to a bearish phase.
So, what does this mean for stocks through September and October?
We are now in the seasonally weakest part of the year, during the months when many of the most significant market bottoms have occurred.
It’s important to reflect on the time frames implied by a head and shoulders top, and how the short-term weakness relates to a long-term bullish phase that appears to still be in place… for now!
In today’s video, we’ll break down the three phases of price patterns: the setup, the trigger, and the confirmation. Now that those requirements have been met, what does that mean for further downside for our growth-oriented equity benchmarks?
- What are the three phases to a price pattern, and why is it important to wait for all three steps to be completed before taking action?
- What downside price objectives are implied by the head and shoulders topping pattern?
- What other key support levels may come into play if the S&P 500 continues it’s distribution phase into October?
[Video] S&P 500 – Bearish Head and Shoulders Pattern
S&P 500 Index Chart
Twitter: @DKellerCMT
The author may have positions in mentioned securities at the time of publication. Any opinions expressed herein are solely those of the author, and do not in any way represent the views or opinions of any other person or entity.


