FIBONACCI RETRACEMENTS SPEAK TO ODDS
If we are to believe the stock market’s rally off the December 2018 low is the last hurrah, we would expect to see some damage on the normal fibonacci retracement front.
Using the last rally into the S&P 500’s major October 2007 peak as an example, if the uptrend was in good shape any pullback or correction would typically remain above the A to B retracements shown below.
Our purpose here is not to compare 2007 and 2019 head-to-head, but rather to use the S&P 500 Index chart below to illustrate basic concepts about trends and fibonacci retracements.
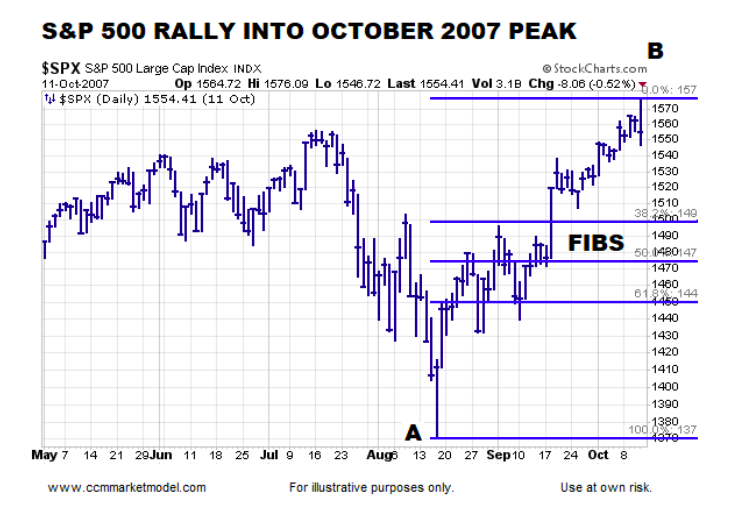
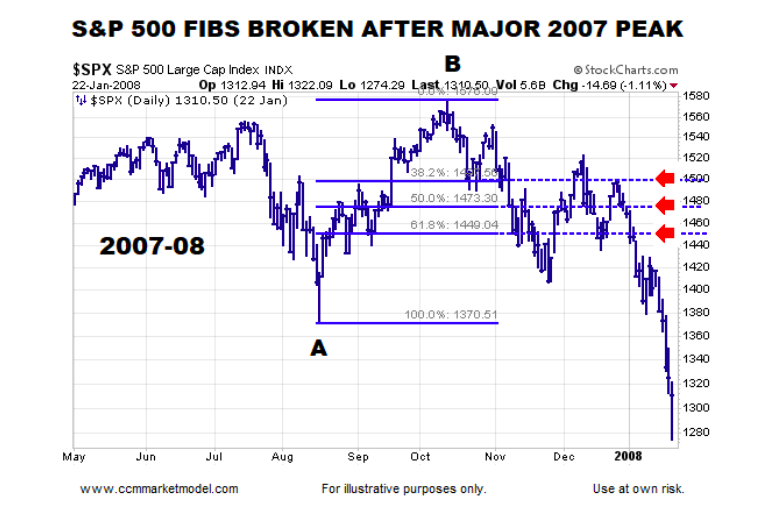
The odds of a new and sustained downtrend forming increase when the market is unable to hold near the three common retracement levels, which is exactly what happened between October 2007 and January 2008.
HOW DOES THE RALLY OFF THE DECEMBER 2018 LOW LOOK?
How concerned are institutions about slowing global growth, recent weakness in U.S. economic data, and the threat of impeachment?
As of this writing, not concerned enough to cause the S&P 500 to take out any of the major retracement levels based on the A to B move off the December 2018 low. Since the S&P 500 July 2019 peak, price has not touched any of the three retracement levels.
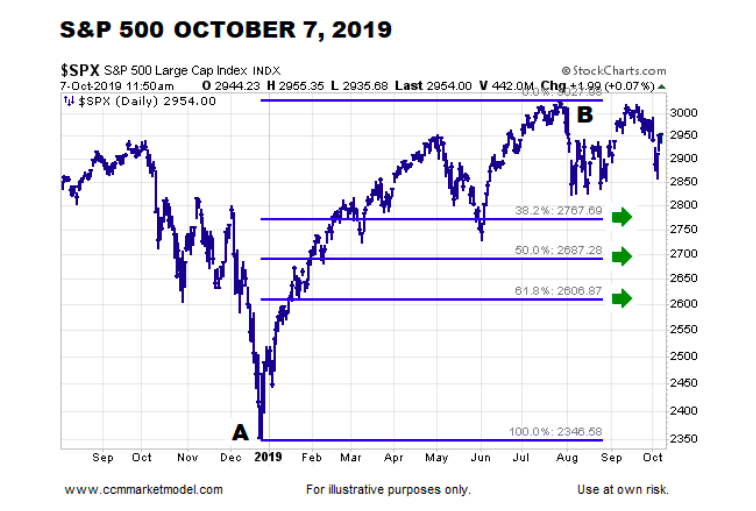
If the rally off the December low is the last move in the current bull market (which may be the case), we should see the S&P 500 eventually move below all three levels shown above. That may indeed happen but it has not happened yet. We will learn something either way (bullish or bearish) in the coming days and weeks.
There is nothing magical about retracements; they simply help us assess the probability of bad things happening relative to the probability of good things happening. Based on what we know today, the bullish trend off the 2018 low remains intact.
TRADE TALKS: WHICH PATH WILL THE MARKET TAKE?
This week’s stock market video covers a wide range of topics, including stress in the labor market, breadth, sentiment, 1994-1995 trade war, recent economic reports, Fed bullets, the death of growth stocks, 1987 parallel, and the psychology of markets. After reviewing the video, you can make your own assessment of potential risk versus potential reward.
BROAD INDEX NEAR AREA OF POSSIBLE SUPPORT
The broad Value Line Geometric Index tells us to keep an open mind about a wide range of outcomes heading into this week’s China trade talks. The concept of “what once acted as major resistance may now act as major support” applies to the red arrows from 1998, 2007, and 2015.
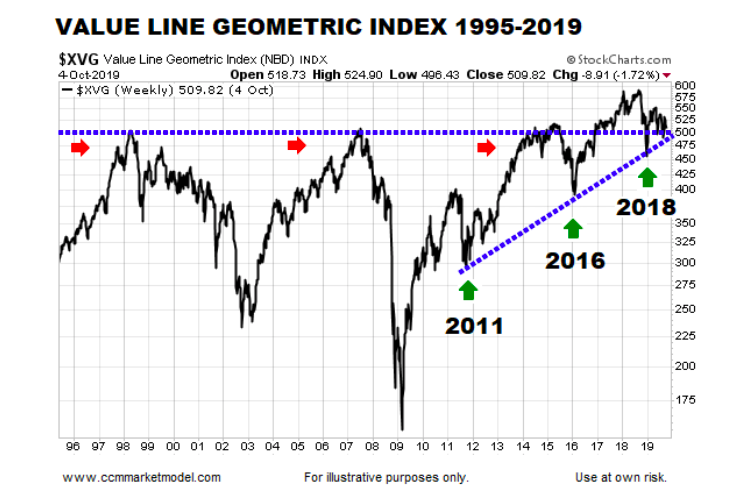
The green arrows above from 2011, 2016, and 2018 tell us the market remains near an important area that should provide additional information either way (support holds or support breaks). We will continue to take it day by day.
Twitter: @CiovaccoCapital
The author or his clients may hold positions in mentioned securities at the time of publication. Any opinions expressed herein are solely those of the author, and do not in any way represent the views or opinions of any other person or entity.

: Showing Some Signs of Emerging Strength")
