After a multi-day stock market decline, many are wondering how far the stock market will fall.
Although I will comment on other price support levels, my main focus will be on lower Fibonacci price supports.
We will look at the S&P 500 today and the Nasdaq 100 (the hardest hit thus far) this weekend.
This exercise is easy and can be done in a matter of minutes. Here we bring it to life on a chart. Fibonacci levels are good to use in conjunction with other support/resistance, such as moving averages, breakout/breakdown areas, and consolidations.
Note that the following MarketSmith charts are built with Investors Business Daily’s product suite.
I am an Investors Business Daily (IBD) partner and promote the use of their products. The entire platform offers a good mix of technical and fundamental data and education.
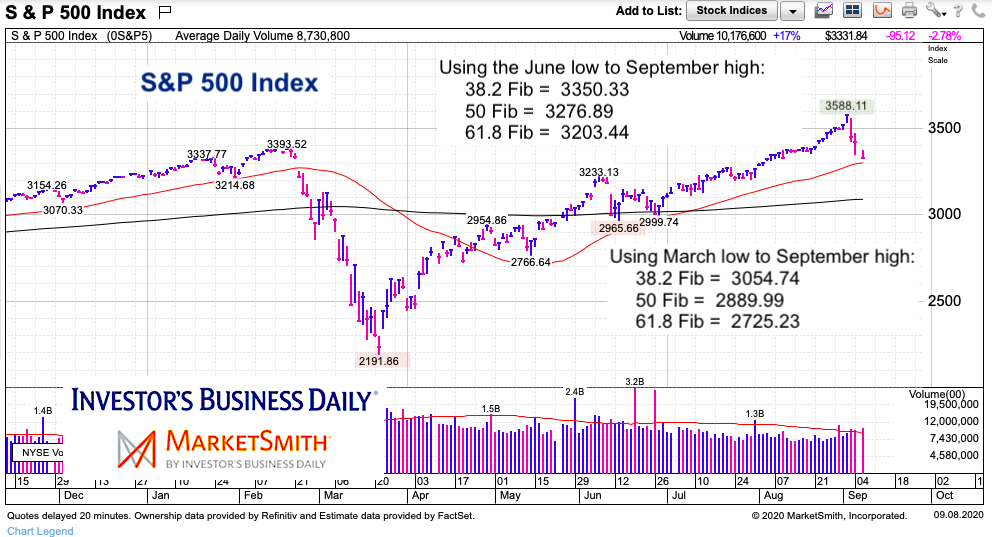
S&P 500 Index Chart
The 3-day selloff has seen the S&P 500 Index fall over 250 points or 7 percent. This has caught the eyes of active investors and peaked our interest in where key price support levels lie. I use these levels to add or reduce exposure to long / short positions and/or to put on new trades.
In this exercise, I used the June low to create some near-term Fibonacci support levels to watch, as well as the March low to create some longer-term levels of interest – see the chart. There are 3 levels that I will highlight here today:
1. The near-term 38.2 Fib sits just above the 50-day moving average. Between those two supports, we have a band from 3300 to 3350 may slow the decline.
2. In the event of a strong break of the 50-day moving average, then we may be looking at a deeper decline. The next level of interest for me is the longer-term 38.2 Fib. This levels sits just below the 200-day moving average and creates a band of support between 3050-3100.
3. A move below the 200-day moving average will likely visit a lower Fib level (50 or 61.8), but the April/May highs and June lows congestion area (2950-3000) would likely slow that decline first.
Twitter: @andrewnyquist
The author is net short via ETFs related to mentioned securities at the time of publication. Any opinions expressed herein are solely those of the author, and do not in any way represent the views or opinions of any other person or entity.


