The latest leg higher in the stock market is nothing more than a continuation of an up-trend (and broader rally).
But if I didn’t say that this was surprising considering the economic and political backdrop, I’d be lying. This is all the more reason to tune out the noise and follow price.
That said, the price action may finally be sending investors a short-term caution signal as we head into the back half of January.
Trend breakdown? No, the up-trend is still strong. All major moving averages are rising and we have yet to see a major price reversal. So what gives?
Price exhaustion. Perhaps we are overheated near-term.
Note that the following MarketSmith charts are built with Investors Business Daily’s product suite.
I am an Investors Business Daily (IBD) partner and promote the use of their products. The entire platform offers a good mix of technical and fundamental data and education.
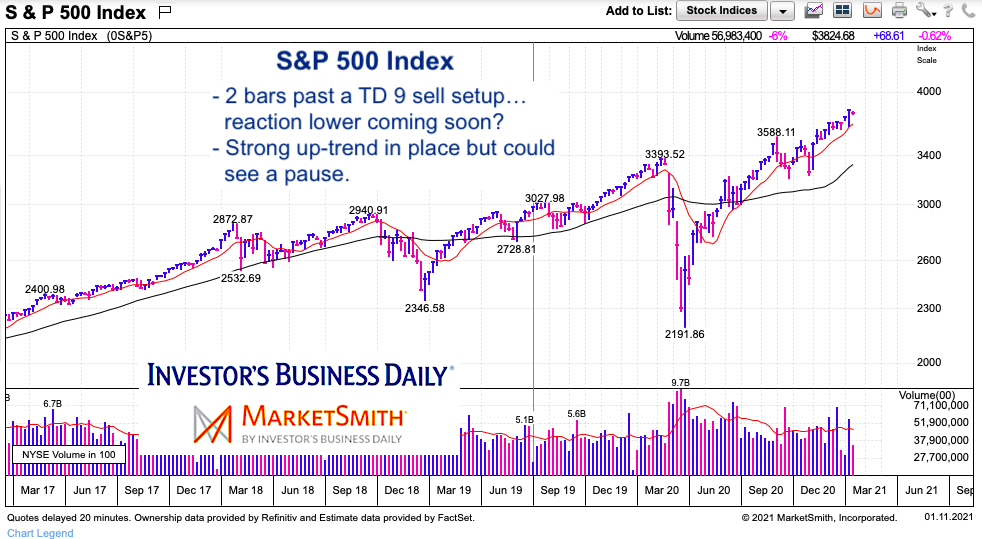
S&P 500 Index “weekly” Chart
Yes, this is a weekly chart, but the exhaustion setup (a DeMark 9 sell setup) is typically only a 1-4 week window for a turn lower. So this is simply an overbought caution signal (or short-term trading setup for a pullback).
To be fair, S&P 500 trend indicators are very strong so we may only see a pause. In any event, there is a risk of a pullback over the next 2-3 weeks. We should know more come February 1st.
Twitter: @andrewnyquist
The author may have a position in mentioned securities at the time of publication. Any opinions expressed herein are solely those of the author, and do not in any way represent the views or opinions of any other person or entity.

: Showing Some Signs of Emerging Strength")
