We recently looked at the chart of several stock market indices after posting a “hanging man” weekly candle.
We asked the question: exhaustion sign or reversal higher? Those ended up being a part of a broader price reversal higher.
Nearly two weeks later, the S&P 500 and Nasdaq, etc have added to gains. And we posit a similar question: is the market nearing exhaustion.
In today’s charts, we will look at the “daily” and “weekly” charts of the S&P 500 Index. As a longer-term investor, the bull market is still in an uptrend. As a tactical, active investor (swing trader), we are watching for signs of exhaustion (or price target areas) to take gains or trim exposure. This is less about being bearish as it is about being smart when you are dealing with narrower timeframes. Take profits, stay in the trend/trade.
Note that the following MarketSmith charts are built with Investors Business Daily’s product suite.
I am an Investors Business Daily (IBD) partner and promote the use of their products. The entire platform offers a good mix of technical and fundamental data and education.
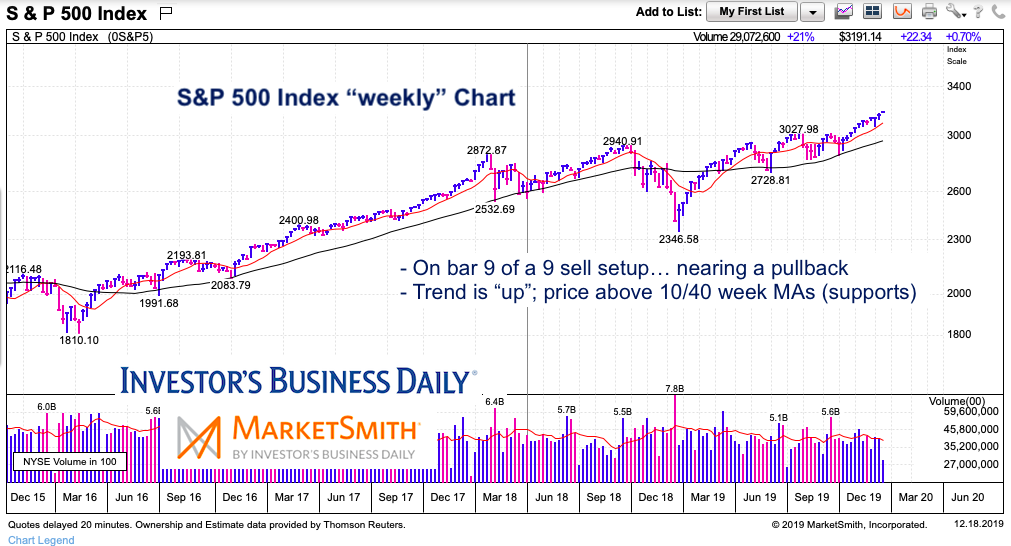
S&P 500 “weekly” Chart
The weekly price chart is for intermediate-term trend investors / swing traders. For a swing trader to stay in trend, they need to understand the intermediate term (for the broader trend or any developing concerns) as well as the short-term (daily chart) for a current view.
The weekly chart is showing a clear uptrend with rising 10 and 40 week moving averages. Those are clear price supports for any pullback. From an exhaustion perspective, price is on weekly bar 9 of a 9 DeMark sell setup. This cautions us that a pullback may be nearing.
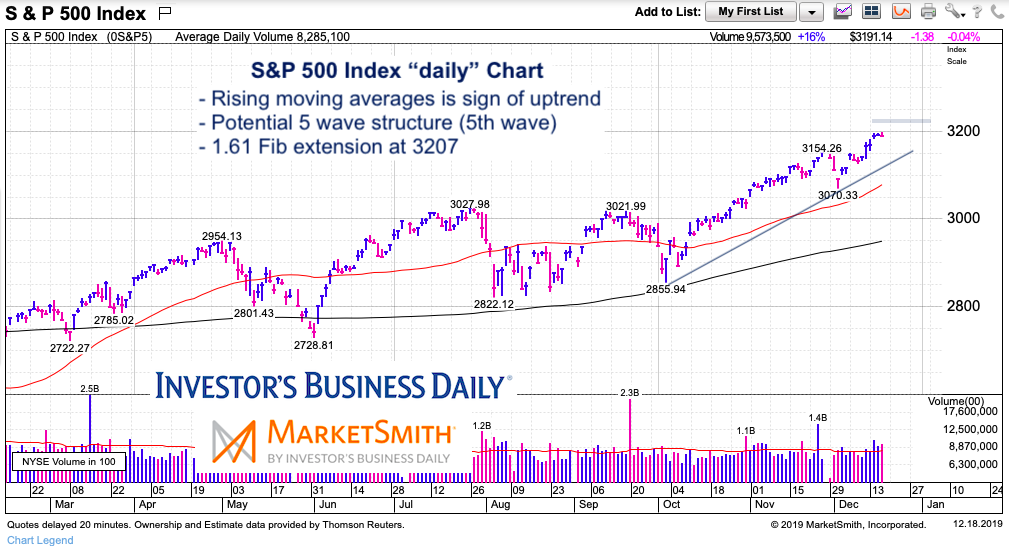
S&P 500 “daily” Chart
On the daily chart, we can once again see the strength of the bull market here. Rising 50 and 200 day moving averages and continued resilience. It’s the holidays, though, so volume is fading.
In this chart exercise, I identify a Fibonacci price extension level as a potential area to fade into (for near-term traders/swings). This area is the 161.8 Fib target at 3207. Also I’m seeing a potential 5 wave trading structure off the October low – caution, I’m not an Elliott wave guy ;-). The larger point is to identify areas to trim and trail (i.e. target areas to pocket some gains while staying in the trend and trade).
Twitter: @andrewnyquist
The author may have a position in mentioned securities at the time of publication. Any opinions expressed herein are solely those of the author, and do not in any way represent the views or opinions of any other person or entity.


: Showing Some Signs of Emerging Strength")
