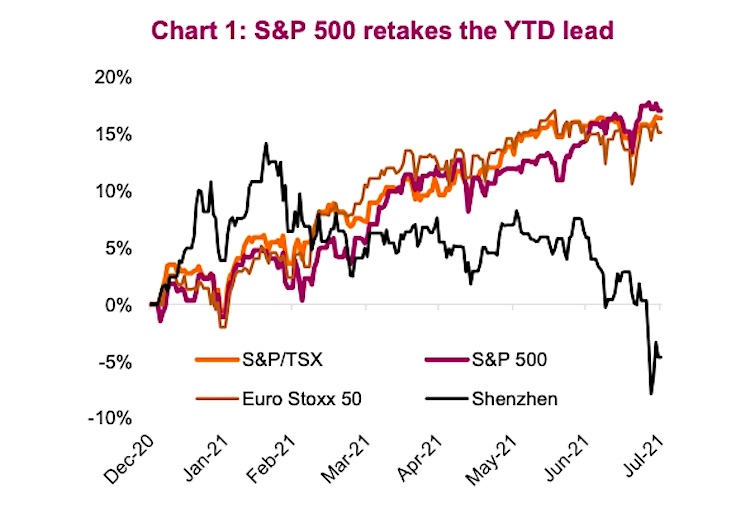
Coming out of halftime, North American equity markets have witnessed a leadership reversal among the major stock market indices.
Canada has slowed, seeing the TSX rise +0.8% in July, yet remaining higher this year by a healthy 18.2%. While Canada has paused, our North American counterpart south of the border has picked up the pace – The S&P 500 rose 2.4% in July, reaching fresh new highs.
In fact, the S&P 500 has made a new record high in each of the last nine months. Too easy. This strong month for the U.S. has the S&P 500 surpassing the S&P/TSX on the year.
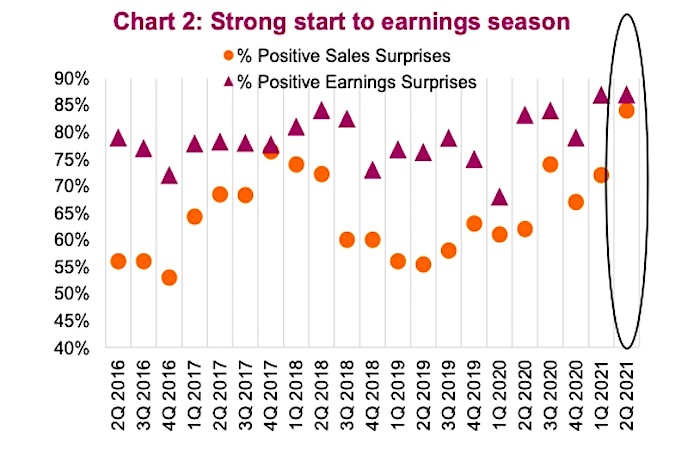
One of the major drivers for the U.S. outperformance has been a very strong start to Q2 earnings season. So far, 294 companies in the S&P 500 have reported second quarter results, with an 84% positive sales surprise rate and a positive earnings surprise rate of 87%. Looking back over the last five years, this would be the highest performance results on both a standalone quarterly and average basis. The average positive earnings surprise is around 78% while the positive sales surprise is only 64%.
Across the ocean, Europe saw modest monthly growth of approximately 0.8% for the Euro Stoxx 50. The bigger story internationally lies with Asia. Japan saw a monthly decline of -5.2% while China is working its way towards a bear market. After a drop of -7.3% in the month of July, the Shenzhen index sits at a 6.4% loss YTD even after leading the global markets earlier this year (see Chart 1 above).
Several reasons are being cited but the crackdown on tech in China is leading the way. The self-perpetuated pullback has been amplified by tensions with the U.S. and while new virus cases have risen globally, the share in the Asia-Pacific region remains high at 35%.
Weakness seen in the Canadian dollar against the US dollar in June carried over into July. Entering the month at just north of $0.80, the CAD touched monthly lows of ~$0.78 but seems to be settling in around $0.80 towards the end of the month. Risk on currencies lost some ground during the month as the USD (risk off currency) continues to gain some short-term traction.
Government bond prices in North America continued to rally, sending yields much lower for the month than where they started. The US 10 YR yield dropped from 1.47% to 1.22% while touching the lows of 1.13% not seen since February. Canada witnessed a similar decline from 1.39% to 1.20%. It was not too long ago when the US 10 YR yield was earning investors 1.74%, the good ol’ days. With the elevated readings on inflation continuing in July, real rates certainly took an unexpected hit with yields falling.
One of the more volatile investments over the last 30 days was crude oil. WTI starting the month out around $72/bbl and finishing out at $74/bbl does not tell the whole story. During the month, OPEC came to an agreement to turn the taps back on. Announcing an increase of 400,000 bpd every month until levels are back to normal pushed prices down as low as $65/bbl, a two-month low for the commodity. The market remains tight even with the extra production as consumers emerge from the pandemic.
Amidst the summer months, a stall in performance is not abnormal in the Canadian markets. Even with the pullback in the CAD and the lackadaisical month for equities, investors have benefitted from continued double-digit equity returns and bonds regaining some ground. Strong earnings and continued vaccination deployment are two solid catalysts that should carry the economy through summer and into the fall.
Source: Charts are sourced to Bloomberg L.P. and Richardson Wealth unless otherwise noted.
Twitter: @ConnectedWealth
Any opinions expressed herein are solely those of the authors, and do not in any way represent the views or opinions of any other person or entity.

 Rolling Over At Key Fibonacci Level?")


