Short-Term Outlook Remains A Mixed Bag
While the primary trend still strongly favors the bulls, the bears have made some progress on the momentum and vulnerability fronts.
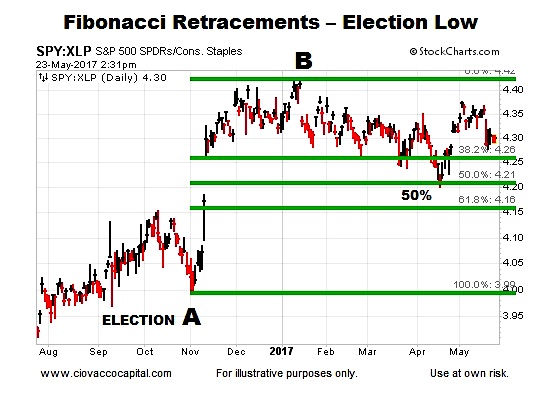
The chart below shows the performance of the SPDR S&P 500 ETF (NYSEARCA:SPY) relative to defensive-oriented SPDR Consumer Staples Sector ETF (NYSEARCA:XLP). From a bullish perspective, the ratio recently held at the 50% retracement, which leaves the door open to the uptrend continuing and the ratio going on to make a higher high. From a bearish perspective, the ratio has not made a higher high since January, which speaks to waning and vulnerable momentum. Intermediate-term bearish odds would improve if the ratio breaks below and stays below the three major Fibonacci retracement levels.
The Way Forward
This week’s stock market video highlights the importance of market fractals in the context of very long-term trends.
Markets Like To Revisit Gaps
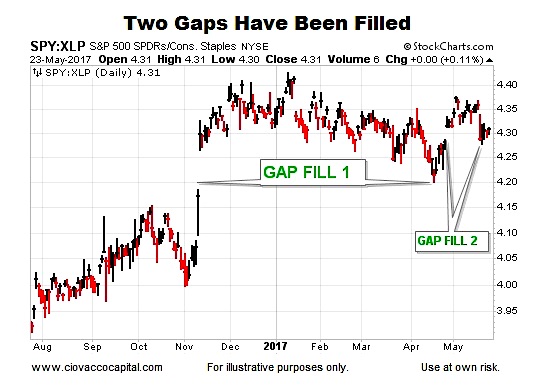
It is very common for markets to retest gaps prior to resuming the existing trend. Therefore, when charts have unfilled or untested gaps, it leaves the door open to future gap-filling weakness. The SPY/XLP ratio had a massive gap up after the U.S. election. The election gap was retested in April and thus far falls in the successful retest category. The ratio experienced a smaller gap up in late April. Last week, the April gap was revisited and, thus far, it appears to be a successful retest. The bears want to see price migrate below the gaps, allowing them to be classified as failed breakouts.
Bulls Want To See A Higher High
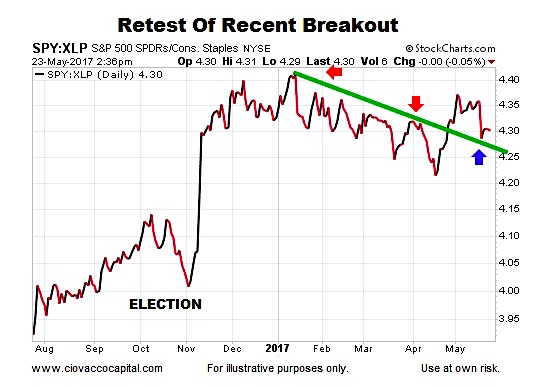
The mixed-bag theme also applies to the SPY/XLP chart below. It is hard to get too excited about the market’s tolerance for risk when the ratio below is making a series of lower highs and lower lows (see downward-sloping green trendline). The bulls have reason to hope with the recent break above the green trendline. The first pass back to the trendline held (above blue arrow). Bearish odds would improve if the ratio is unable to hold above the green trendline.
Get more investing research from Chris on his CCM website. Thanks for reading.
Twitter: @CiovaccoCapital
The author or his clients may hold positions in mentioned securities at the time of publication. Any opinions expressed herein are solely those of the author, and do not in any way represent the views or opinions of any other person or entity.


