Stock Market Trading Considerations For October 3, 2017
The S&P 500 (INDEXSP:.INX) is are flat heading into Tuesday’s trading session in U.S. markets. The rally is a bit stretched near-term but still could test upper price resistance around 2535-2540 if buyers remain aggressive.
Check out today’s economic calendar with a full rundown of releases. And note that the charts below are from our premium service and shared exclusively with See It Market readers.
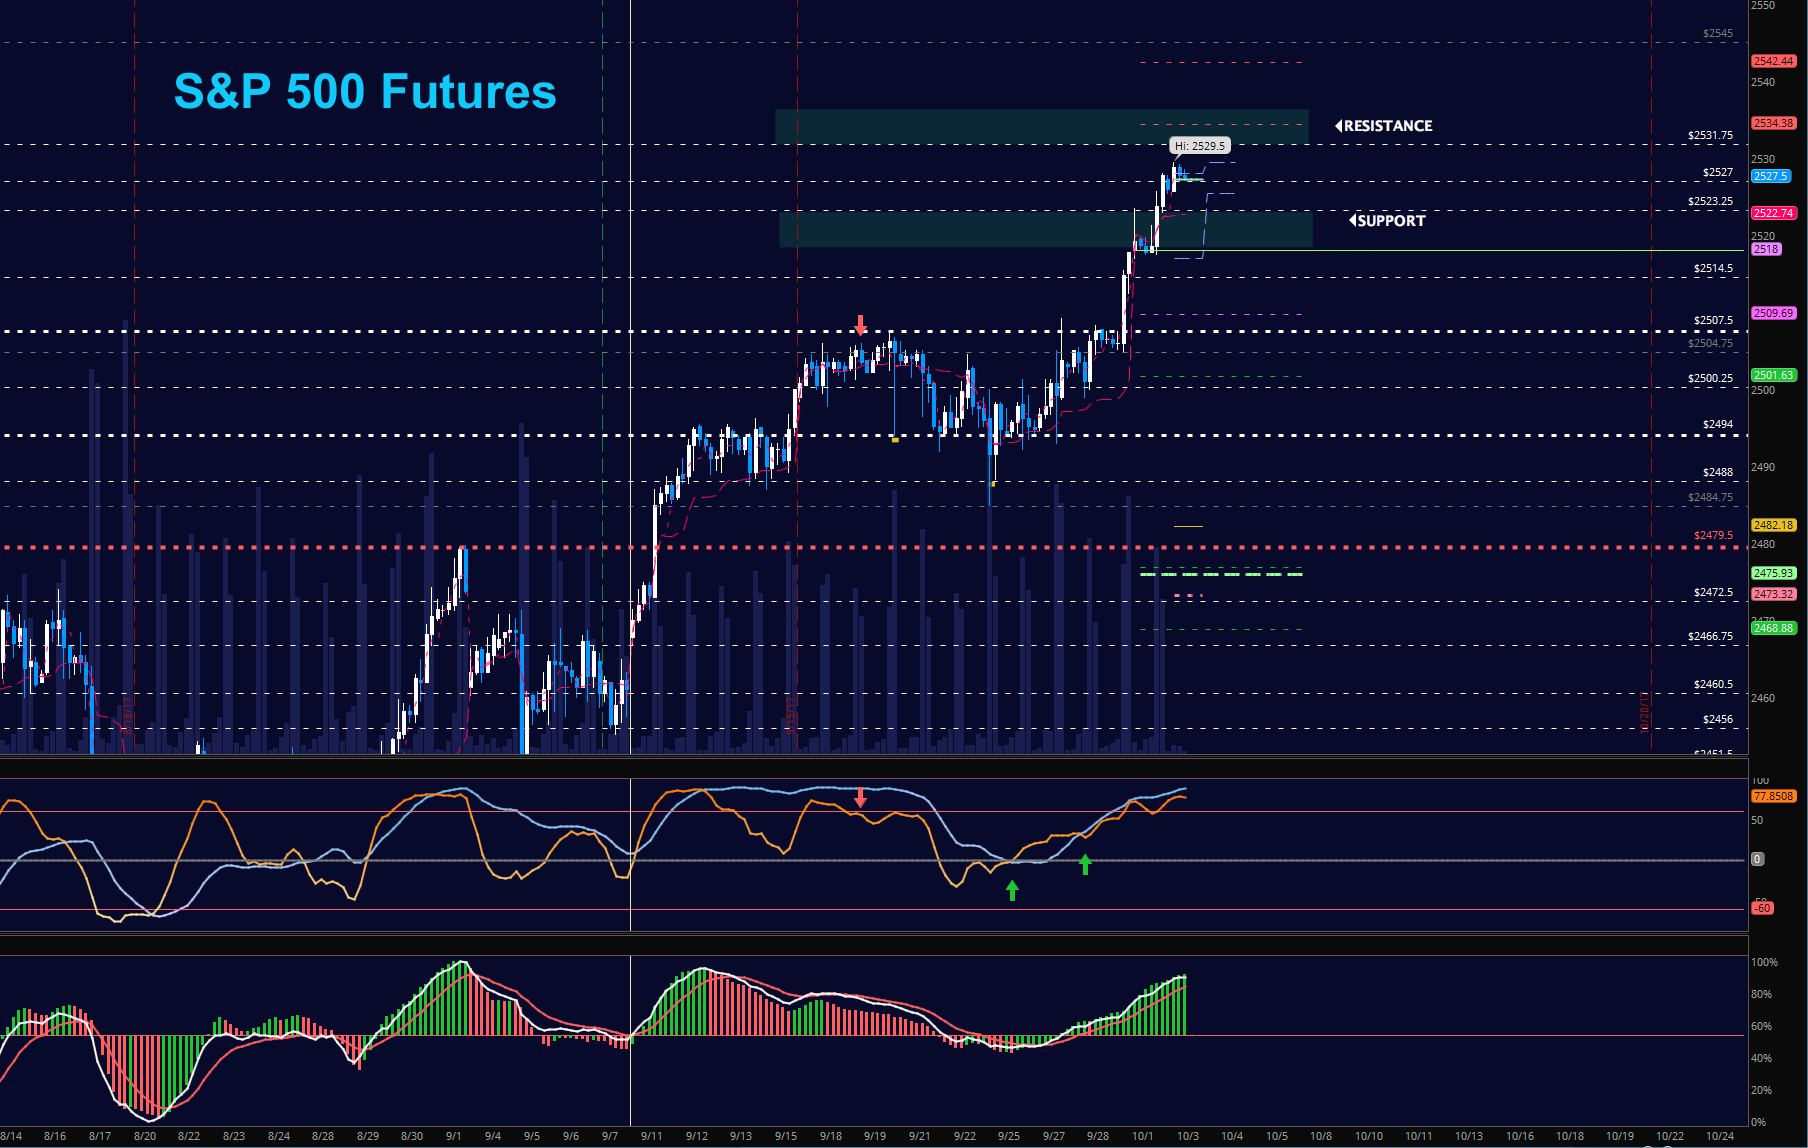
S&P 500 Futures (ES)
New highs yet again in the overnight session as charts continue to spike into upper sigma band extensions. New support remains at the new breakout area near 2514 with 2511 just below. Formations are bullish but slightly divergent, so a watch for the failure to hold support, or the failure to test higher will signal slowing. The bullets below represent the likely shift of trading momentum at the positive or failed retests at the levels noted.
- Buying pressure intraday will likely strengthen above a positive retest of 2525
- Selling pressure intraday will likely strengthen with a failed retest of 2517
- Resistance sits near 2527.5 to 2529.5, with 2534.5 and 2537.25 above that.
- Support holds between 2523.25 and 2517.5, with 2514.25 and 2504.25 below that.
NASDAQ Futures (NQ)
Momentum shows as mixed as traders push this chart tests resistance. Holding higher lows means we still have buyers in charge. Buyers need to hold 5976 for continuation forward. The bullets below represent the likely shift of intraday trading momentum at the positive or failed tests at the levels noted.
- Buying pressure intraday will likely strengthen with a positive retest of 5992 (but only into resistance)
- Selling pressure intraday will likely strengthen with a failed retest of 5976
- Resistance sits near 5997.75 to 6002.5, with 6009.5 and 6017.5 above that (a pivot looms high above at 6055.75).
- Support holds between 5978.5 and 5960, with 5947.25 and 5934.75 below that.

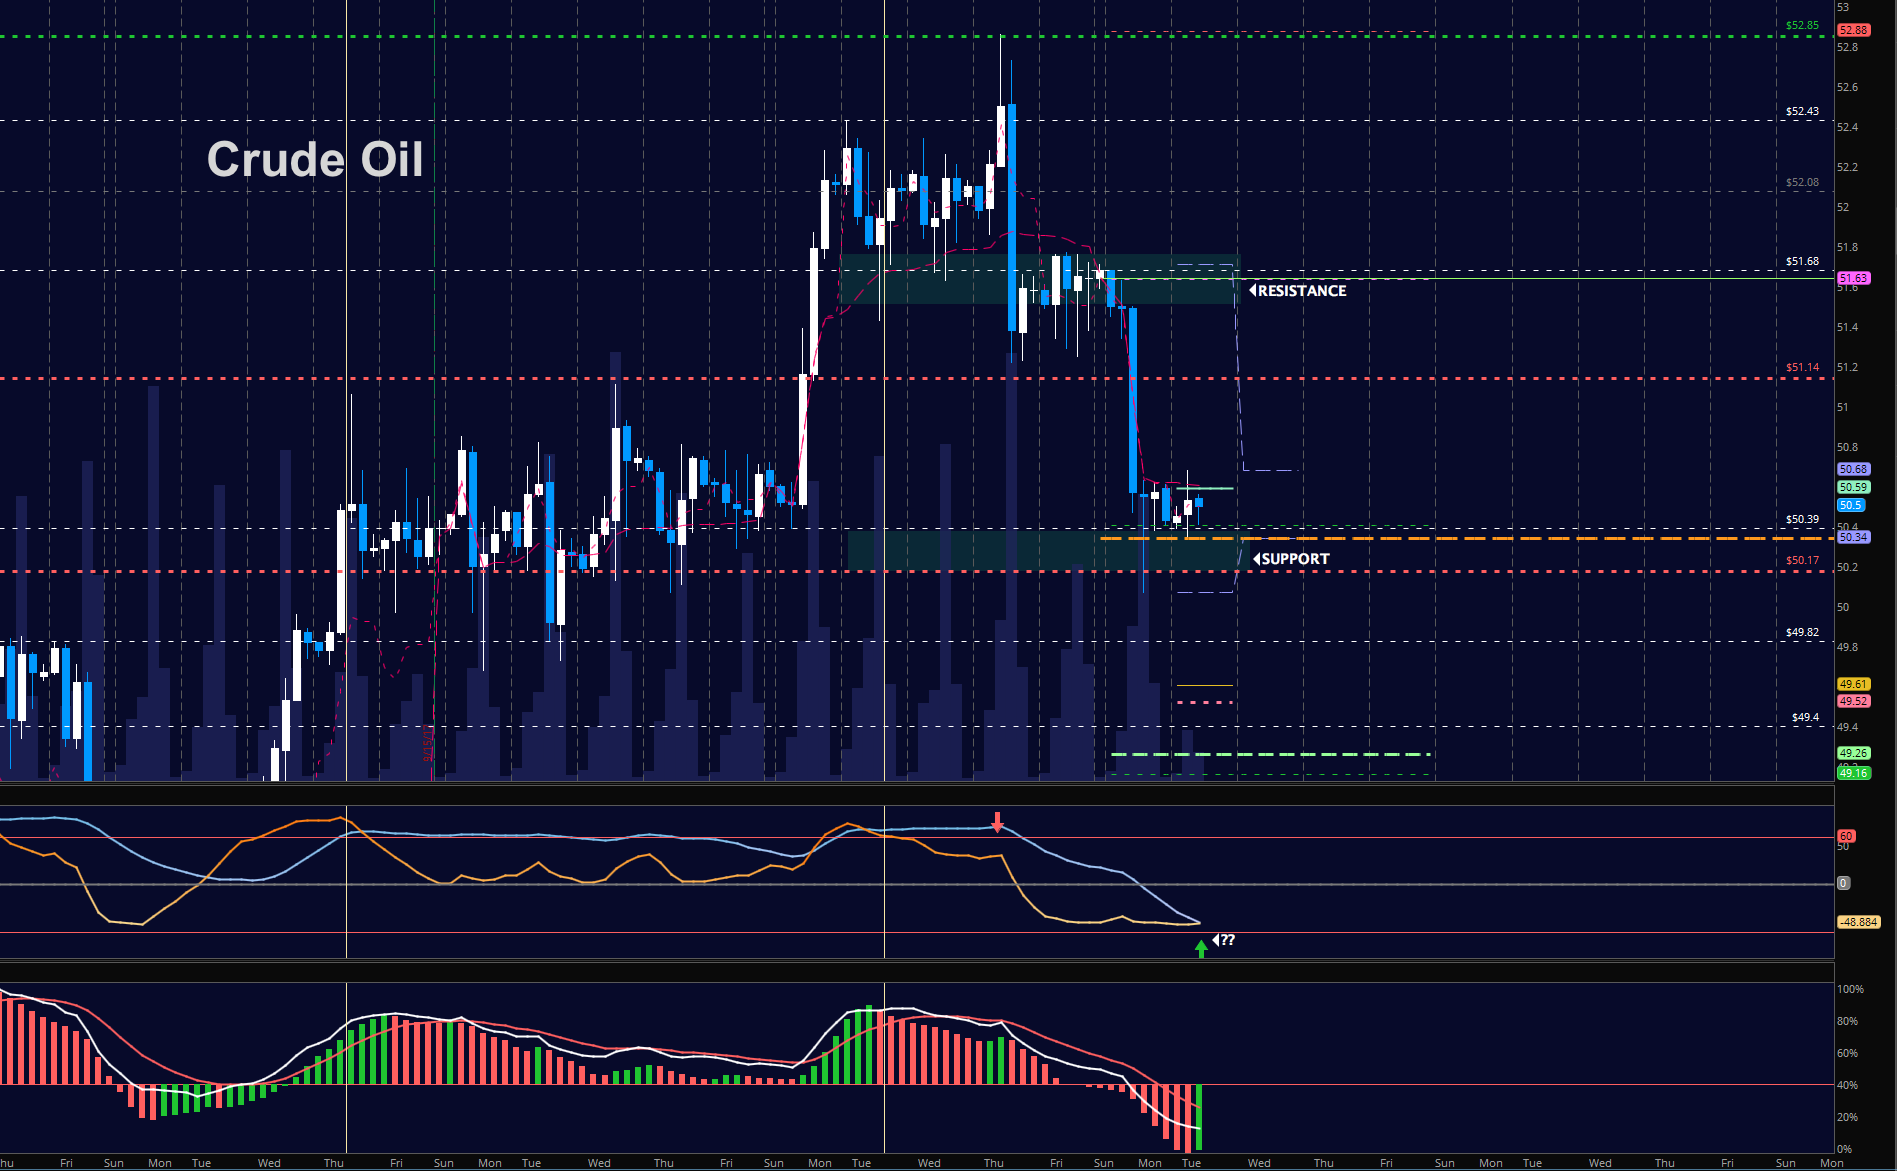
WTI Crude Oil
A war is raging at 50.34 to hold support levels into the API report here. Drillers continue to pull oil out of the earth at swift levels lifting supplies across the board increasing supply events. There is a bounce brewing here at support, but this seems to be poised to fail under the weight of sellers. The bullets below represent the likely shift of trading momentum at the positive or failed tests at the levels noted.
- Buying pressure intraday will likely strengthen with a positive retest of 50.84
- Selling pressure intraday will strengthen with a failed retest of 50.12
- Resistance sits near 50.7 to 51.1, with 51.58 and 52.06 above that.
- Support holds between 50.34 to 50.14, with 49.84 and 49.49 below that.
If you’re interested in watching these trades go live, join us in the live trading room from 9am to 11:30am each trading day. Visit TheTradingBook for more information.
If you’re interested in the live trading room, it is now primarily stock market futures content, though we do track heavily traded stocks and their likely daily trajectories as well – we begin at 9am with a morning report and likely chart movements along with trade setups for the day.
As long as the trader keeps himself aware of support and resistance levels, risk can be very adequately managed to play in either direction as bottom picking remains a behavior pattern that is developing with value buyers and speculative traders.
Twitter: @AnneMarieTrades
The author trades stock market futures every day and may have a position in mentioned securities at the time of publication. Any opinions expressed herein are solely those of the author, and do not in any way represent the views or opinions of any other person or entity.


 Ready To Break Out?")

