S&P 500 Futures Outlook for May 9, 2016 – The charts quickly rebounded after a weak jobs number release and the market held key support well into Monday morning. Stock market futures now sit just below heavy congestion and some resistance between 2059 and 2062.25.
Today’s important price battle is likely to take place within a range (2051 – 2065), with a failure to hold 2051.5 as bearish and the breach of 2065 as bullish. Momentum will be key here as price action pushes north. A failed retest of 2062 under real negative momentum will deliver a good short, but so far, that is not on the table.
If S&P 500 futures are able to keep the 2052.5 retest, buyers will be more likely to add steam to the retrace upward back into resistance near 2061.75, and 2064.5, before sellers try to force buyers back down. Heavy congestion resides up there intraday. If not, we’ll see that 2046-2048 again. We’ve tested our target below at 2034 and recovered, but we are likely to see another test of these 2040’s, if momentum holds its present form.
Momentum on the four hour chart is mixed between form and location, suggesting that bounces will be still be sold, and pullbacks will be bought. There seems to be quite a bit of buying power lurking beneath the surface here, so I will be careful with short action in the early part of the day. Several lines of sellers are still set to prevent the advance of price upward – 2061.5, 2064.5 and 2068.75. Support levels sit near 2034-2037.
See today’s economic calendar with a rundown of releases.
THE RANGE OF TUESDAY’S MOTION
Crude Oil Futures (CL_F)
Outlook for Crude Oil May 9, 2016 – Buyers are having trouble holding charts above 45.74, but hold support nicely at the 45.06 region of congestion currently. We have a gap that will likely be addressed at 44.56 – that should be a zone buyers try to actively defend here at the first pass. Formations are generally bullish for oil prices but with an undercurrent of selling momentum trying to catch hold which should drive the chart into the fill of the gap mentioned.
Crude oil’s trading range suggests support action near 44.56, and resistance behavior near 45.94.
Upside trades on crude oil futures can be staged on the positive retest of 45.04, or a bounce off 44.57 with positive momentum. I often use the 30min to 1hr chart for the breach and retest mechanic. Targets from 44.57 are 44.78, 44.94, 45.04, 45.34, 45.57, 45.74, 46.05, and if we can catch a bid there, we could expand into 46.43 to 46.94, but that continues to seem extremely unlikely as overhead supply still appears heavy.
Downside trades seem feasible below the failed retest of 45.27, or at the failed retest of 45.7 with negative divergence – careful to watch for higher lows at the short on the resistance level. Buyers are sitting all over this chart this morning, but momentum suggests they are weak. Retracement into lower levels from 45.7 give us the targets 45.27, 45.04, 44.87, 44.57, 44.34, 44.07, 43.83, and perhaps 43.59, to 43.38, and 42.94.
E-mini S&P 500 Futures (ES_F)
Below is a S&P 500 futures chart with price support and resistance trading levels for today. Click to enlarge.
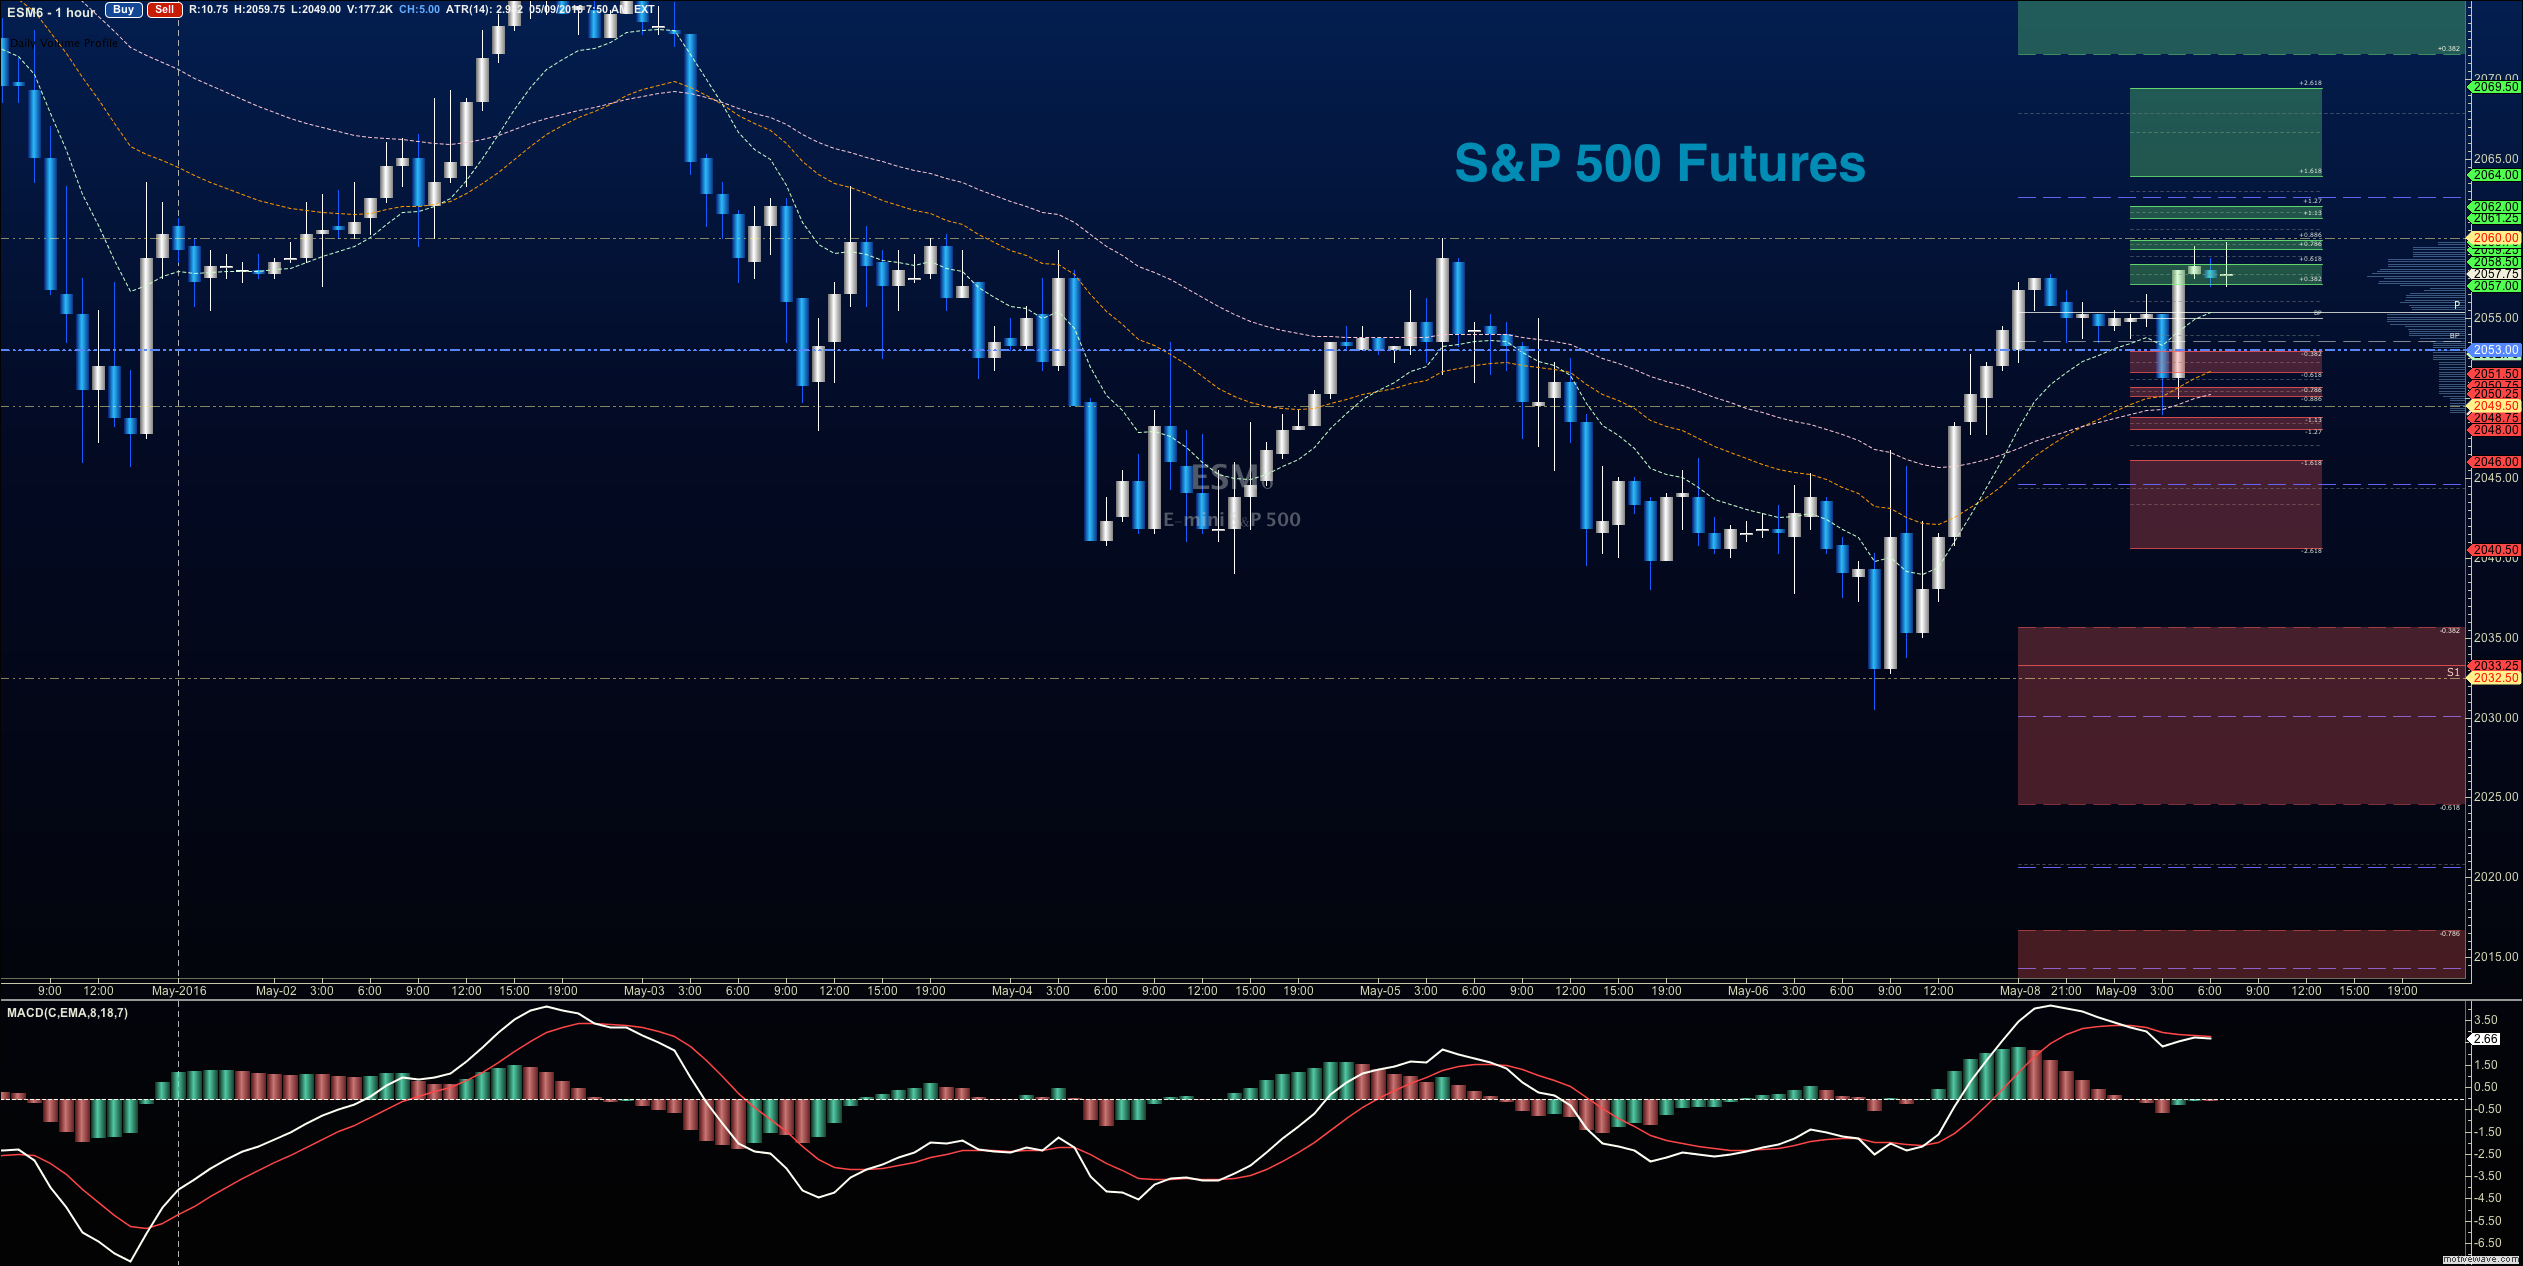
S&P 500 futures outlook for May 9, 2016 – Positive momentum with negative trend is current state – that means messy trading, with expansions to the north getting sold off at resistance, and drifts to the south getting bought up at support.
Upside trades will be into resistance with the 4hour time frame in mind, but the best setup sits on the positive retest of 2054.5, or a bounce off 2051.5 with positive momentum – keep your eyes on 2059.25 with this 2054.5 entry. I use the 30min to 1hr chart for the breach and retest mechanic. Targets from 2054.5 are 2057.25, 2059.25, 2061.75, 2064.25, 2067.5, 2069.25, and if we can catch a bid there, we could expand into 2071.5, 2073.25, 2075.5, and 2077.75.
Downside trades open below the failed retest of 2050.5 or at the failed retest of 2060.25 with negative divergence. Retracement into lower levels from 2060.25 gives us the targets 2057.5, 2055.25, 2053.5, 2050.75, 2047.75, 2044.5, 2042.5, 2039.5, 2035.5, 2037.25, 2034, and perhaps 2031.25 to 2029.25, though these downside targets seem quite unlikely at this writing.
If you’re interested in the live trading room, it is now primarily stock market futures content, though we do track heavily traded stocks and their likely daily trajectories as well – we begin at 9am with a morning report and likely chart movements along with trade setups for the day.
As long as the trader keeps himself aware of support and resistance levels, risk can be very adequately managed to play in either direction as bottom picking remains a behavior pattern that is developing with value buyers and speculative traders.
Twitter: @AnneMarieTrades
The author trades stock market futures every day and may have a position in mentioned securities at the time of publication. Any opinions expressed herein are solely those of the author, and do not in any way represent the views or opinions of any other person or entity.


 Trading Into Inflection Point")


