Broad Stock Market Outlook for April 4, 2018
As mentioned yesterday, in these selling territories, bounces are usually relief spots for only a time and send us into trapped buyers.
Today traders are skittish with the added news of trade tariffs coming from China. Selling on bounces remains the order of the day until we fail to make new intraday lows.
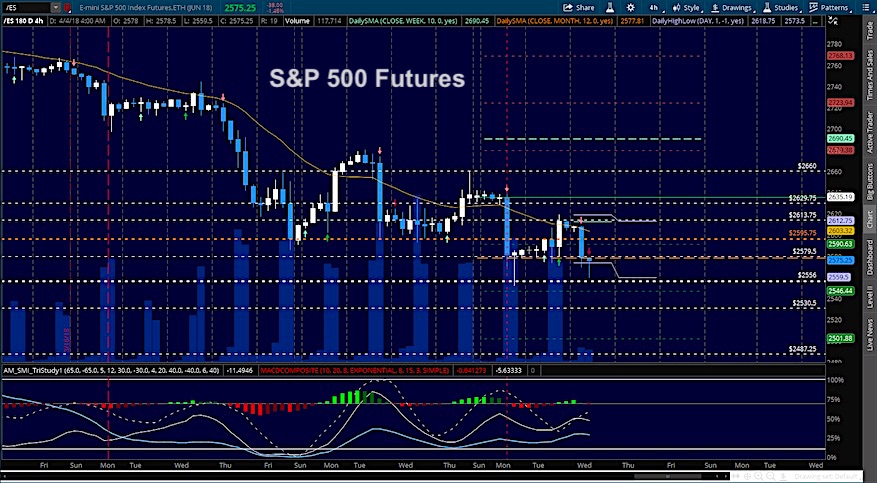
S&P 500 Futures
Being in selling territory means that our resistance regions provide selling opportunities and we are in selling territory today beneath 2584. The bullets below represent the likely shift of trading momentum at the positive or failed retests at the levels noted.
- Buying pressure intraday will likely strengthen with a bullish retest of 2587.50
- Selling pressure intraday will likely strengthen with a bearish retest of 2565.50
- Resistance sits near 2584.5 to 2597.5, with 2618.25 and 2629.75 above that.
- Support sits between 2574.25 and 2566.5, with 2554.5 and 2532.50.
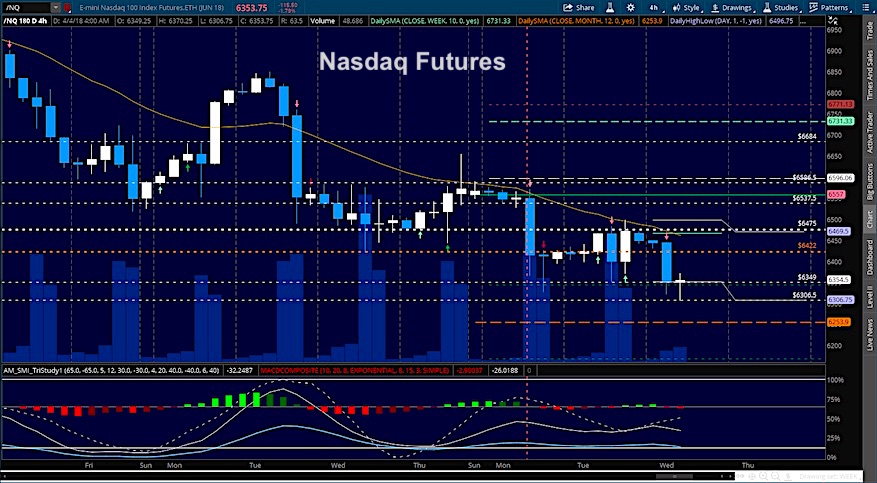
NASDAQ Futures
This chart continues to get pummelled as bounces provide relief for trapped buyers who leave their positions and price continues down. We are at lower support but bounces are still likely to fade under negative. The bullets below represent the likely shift of intraday trading momentum at the positive or failed tests at the levels noted.
- Buying pressure intraday will likely strengthen with a bullish retest of 6377.5
- Selling pressure intraday will likely strengthen with a bearish retest of 6342.75
- Resistance sits near 6384.5 to 6422.75 with 6473.5 and 6505.25 above that.
- Support sits between 6342.5 and 6306.5, with 6255.25 and 6194 below that.
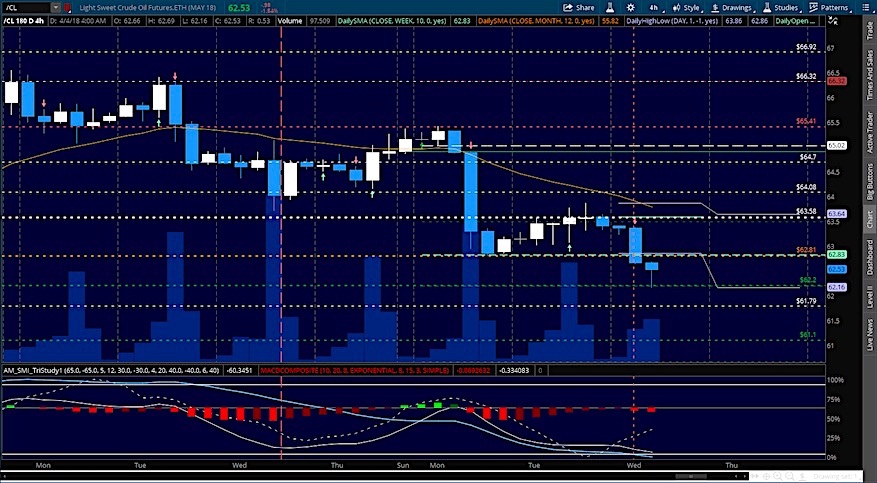
WTI Crude Oil
Traders forced price into deep support near the noted 62.20 before a bounce and the EIA port today. As we drift deeper, we are more likely to find buyers, but with momentum so sharply negative, we should still consider shorts as the primary motion. Below 62.78, sellers are likely to have primary control. The bullets below represent the likely shift of intraday trading momentum at the positive or failed tests at the levels noted.
- Buying pressure intraday will likely strengthen with a bullish retest of 62.87
- Selling pressure intraday will strengthen with a bearish retest of 62.15
- Resistance sits near 62.64 to 63.3, with 63.6 and 64.5 above that
- Support holds near 62.17 to 61.75, with 61.25 and 60.79 below that
Twitter: @AnneMarieTrades
The author trades stock market futures every day and may have a position in mentioned securities at the time of publication. Any opinions expressed herein are solely those of the author, and do not in any way represent the views or opinions of any other person or entity.

: Creating Bullish Divergence?")

: Creating Bullish Divergence?")


