Broad Stock Market Futures Outlook for June 6, 2018
Moves through price resistance are occurring under a continued technical divergence. On the daily charts, we press towards regions seen earlier in the year.
Allow for pullbacks to support to choose long positions. Pullbacks remain buying areas so be patient if choosing your trading directions.
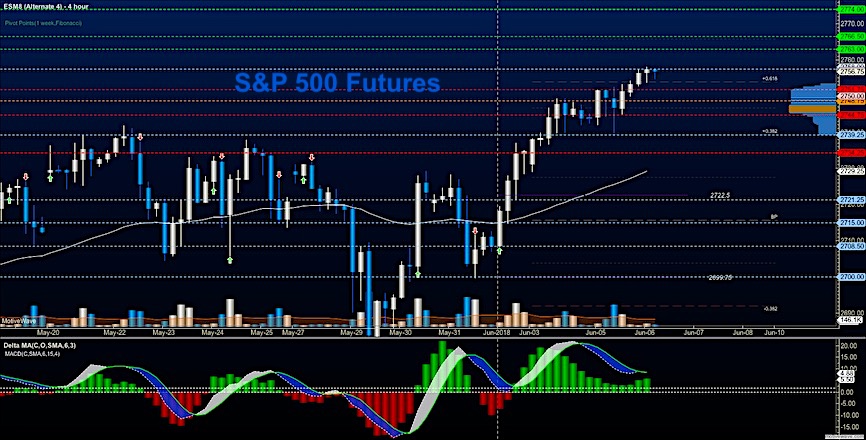
S&P 500 Futures
New intraday resistance levels in the early morning once again as bullish price action holds under negative divergence. Fades will be buying opportunities as the charts and traders remain optimistic – and under these formations, fades are quite likely. Chasing breakouts need to be quick trades. The bullets below represent the likely shift of trading momentum at the successful or failed retests at the levels noted.
- Buying pressure intraday will likely strengthen with a bullish retest of 2757.50
- Selling pressure intraday will likely strengthen with a bearish retest of 2749.5
- Resistance sits near 2756.5 to 2759.75, with 2762.75 and 2767.75 above that
- Support sits between 2752.25 and 2749.75, with 2744.5 and 2739.5
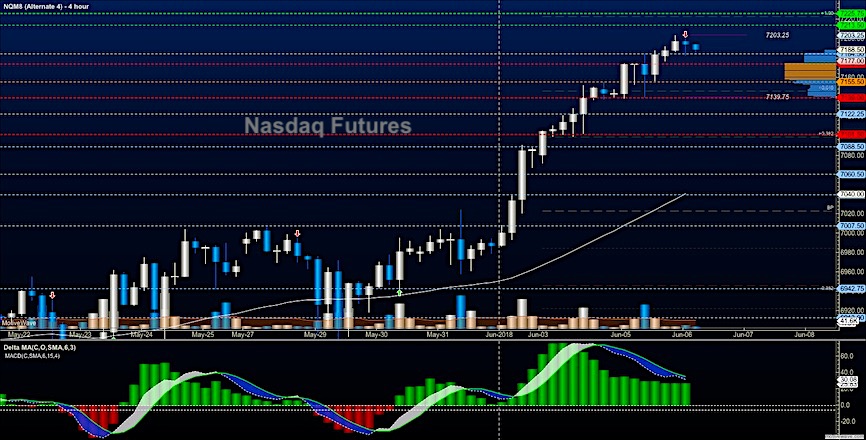
NASDAQ Futures
Tech has stalled after breaching the 7200 but holding higher support levels for another day – this time at 7154. Formations remain generally bullish but divergent, making pullbacks excellent opportunities for entry. Divergent action tells us not to buy highs that present themselves, but instead wait for the pullback to minimize risk. The bullets below represent the likely shift of trading momentum at the successful or failed retests at the levels noted.
- Buying pressure intraday will likely strengthen with a bullish retest of 7195
- Selling pressure intraday will likely strengthen with a bearish retest of 7154.5
- Resistance sits near 7190.75 to 7204.25 with 7213.25 and 7223.5 above that
- Support sits between 7177.5 and 7161.5, with 7139.75 and 7122.75 below that.
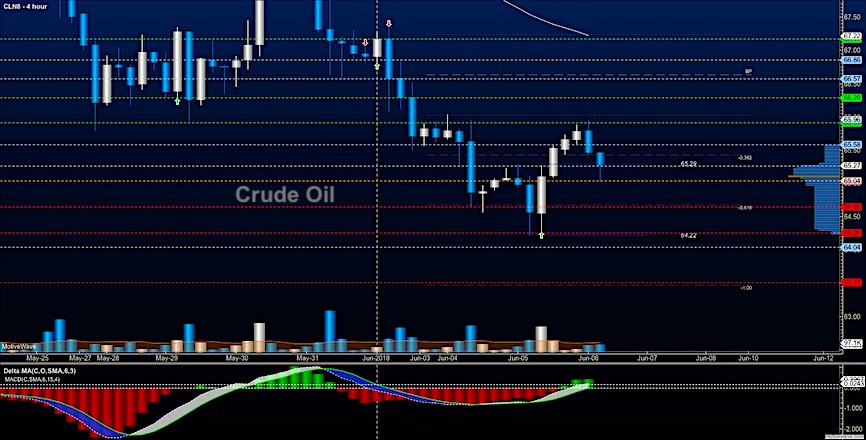
WTI Crude Oil
Oil traders are attempting a rebound filled with trapped buyers caught on the wrong side of the trade trying to catch the lows. A new higher support near 65.05 is forming – below there we could easily retest lows. The EIA report is today. The bullets below represent the likely shift of trading momentum at the successful or failed retests at the levels noted.
- Buying pressure intraday will likely strengthen with a bullish retest of 65.59
- Selling pressure intraday will strengthen with a bearish retest of 64.83
- Resistance sits near 65.48 to 65.64, with 65.96 and 66.29 above that
- Support holds near 65.04 to 64.72, with 64.26 and 64.07 below that
You can learn more about trading and our memberships HERE.
Twitter: @AnneMarieTrades
The author trades stock market futures every day and may have a position in mentioned securities at the time of publication. Any opinions expressed herein are solely those of the author, and do not in any way represent the views or opinions of any other person or entity.
: Creating Bullish Divergence?")


 and Semiconductors (SMH): Concerning Price Pattern?")


