Broad Stock Market Outlook for April 3, 2018
Deep dips hold us in sellers territory. Bounces are afoot but weak and likely to find trapped buyers at new resistance.
I will be watching for the failure to make new lows as the key that the selling has stopped and shorts can be trimmed. Until then, bounces give traders good places to resume selling.
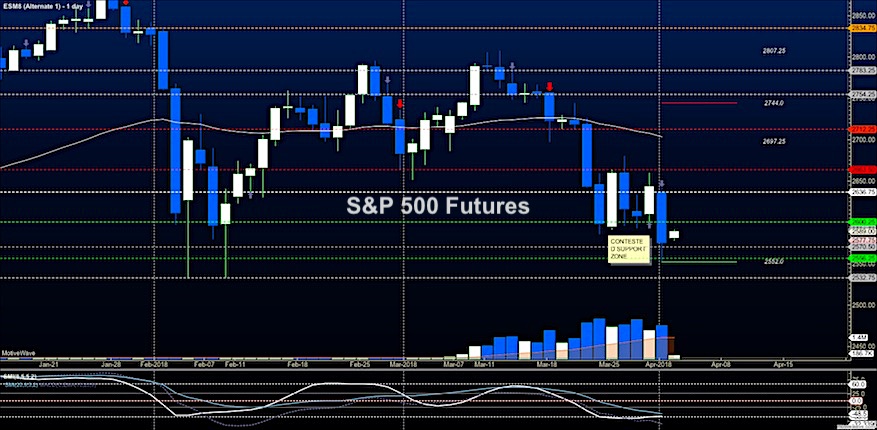
S&P 500 Futures
The challenge of resistance is now near 2600 and it still remains the line in the sand between buyers and sellers. We are in selling territory with any bounces beneath here as I see it. The bullets below represent the likely shift of trading momentum at the positive or failed retests at the levels noted.
- Buying pressure intraday will likely strengthen with a bullish retest of 2607.50
- Selling pressure intraday will likely strengthen with a bearish retest of 2585.50
- Resistance sits near 2603.5 to 2616.75, with 2629.25 and 2658.75 above that.
- Support sits between 2589.25 and 2578.5, with 2554.5 and 2532.50
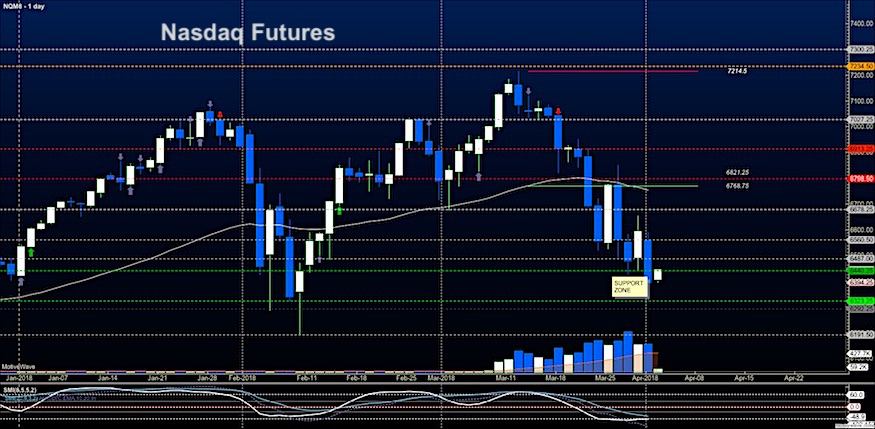
NASDAQ Futures
Messy and contested support sits around 6425 as traders try to press us above resistance near 6440. Trapped buyers suggest that bounces will fail at the first pass as momentum remains negative. The bullets below represent the likely shift of intraday trading momentum at the positive or failed tests at the levels noted.
- Buying pressure intraday will likely strengthen with a bullish retest of 6487.50
- Selling pressure intraday will likely strengthen with a bearish retest of 6425
- Resistance sits near 6483.5 to 6508.75 with 6560.5 and 6678.25 above that.
- Support sits between 6430.5 and 6394.5, with 6323.25 and 6194 below that.
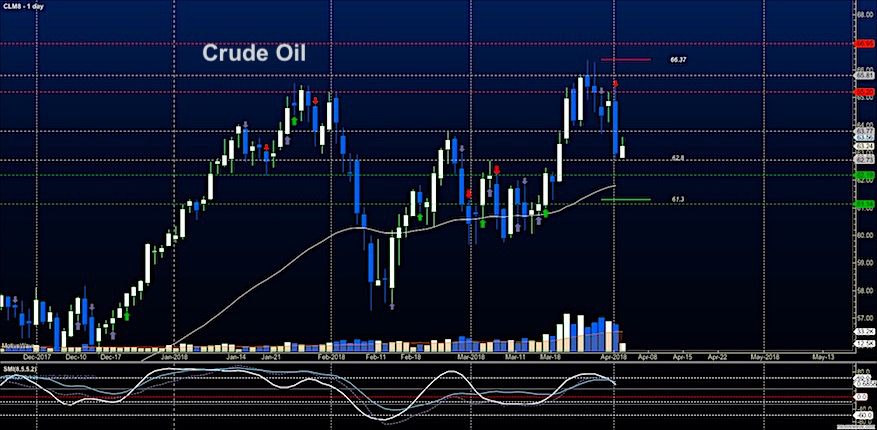
WTI Crude Oil
Traders forced price from resistance and now are taking us back to congestion zones between 63.7 and 62.20. Momentum is drifting lower as we test deeper support but lots of buyers sit in deep congestion zones. Below 63.5, it appears there are move sellers forcing us down. Above 63.9, we should see buyers become a bit braver. The bullets below represent the likely shift of intraday trading momentum at the positive or failed tests at the levels noted.
- Buying pressure intraday will likely strengthen with a bullish retest of 63.90
- Selling pressure intraday will strengthen with a bearish retest of 62.70
- Resistance sits near 63.77 to 64.36, with 65.27 and 66.45 above that.
- Support holds near 62.73 to 62.2, with 61.65 and 61.03 below that.
Twitter: @AnneMarieTrades
The author trades stock market futures every day and may have a position in mentioned securities at the time of publication. Any opinions expressed herein are solely those of the author, and do not in any way represent the views or opinions of any other person or entity.


")


