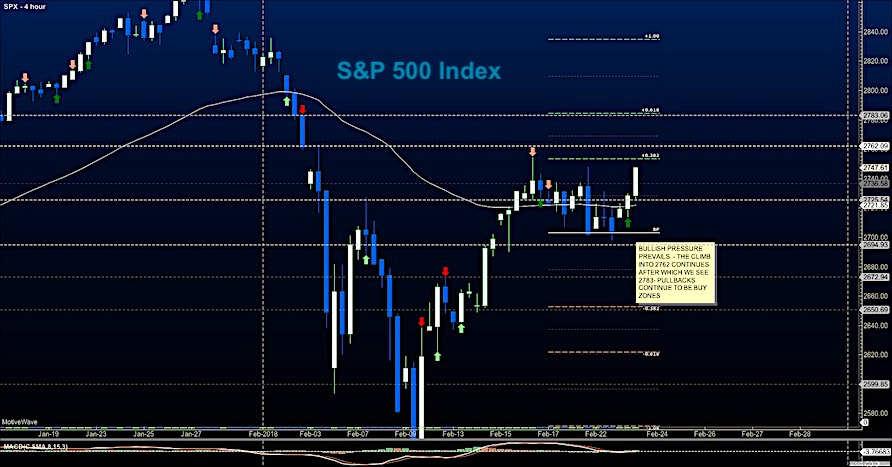
Broad Stock Market Outlook for February 26, 2018
S&P 500 futures sit above important price support of 2705. The market is also support by the fact that we breached important near-term price resistance at 2747. How well we hold this price area on a retest will be a clue to future direction. But for now, signals point north.
Last Friday’s rally has turned near-term momentum bullish.
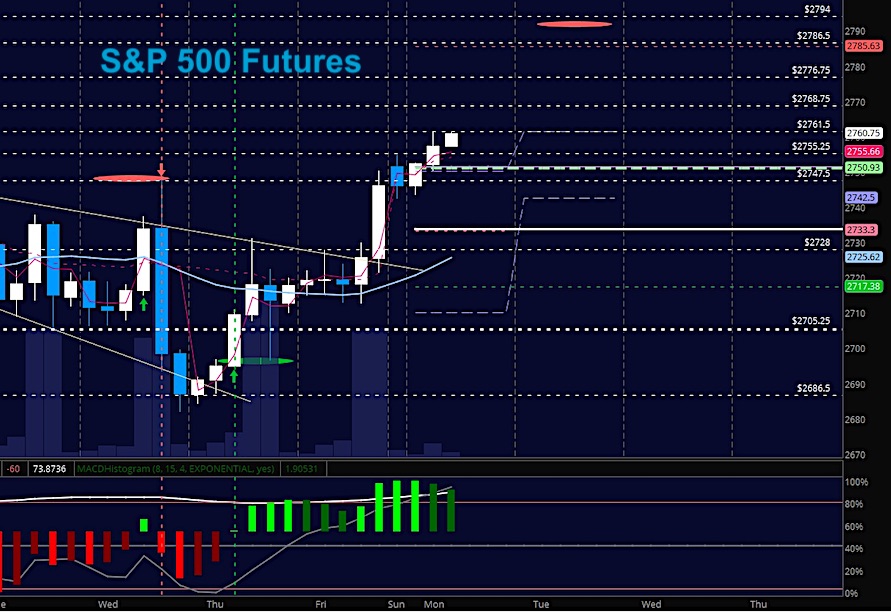
S&P 500 Futures
Resistance holds near 2729 in a week challenged by crosscurrents. We do look a bit weaker from a bullish perspective. Failure to break and hold above 2736 will bode poorly for recovery and we do see the lower highs showing as sellers advance their lines downward. The weight sits on the traders supporting 2705. Holding their feet there will be key for buyers. The bullets below represent the likely shift of trading momentum at the positive or failed retests at the levels noted.
- Buying pressure intraday will likely strengthen with a positive retest of 2761.5
- Selling pressure intraday will likely strengthen with a failed retest of 2749
- Resistance sits near 2760.75 to 2768.5, with 2776.5 and 2786.5 above that.
- Support sits between 2755.5 and 2747.5, with 2742.25 and 2733.5 below that.
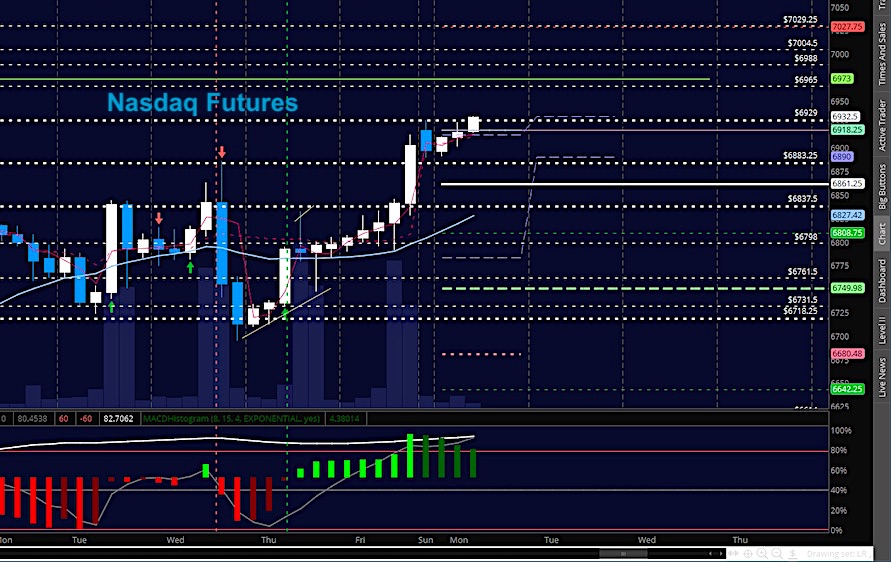
NASDAQ Futures
Momentum has rotated positively into bullish spaces in the near term as we approach resistance of 6935. Higher support now holds at 6890 – which is a clear break above our range noted on Friday near 6870. The bullets below represent the likely shift of intraday trading momentum at the positive or failed tests at the levels noted.
- Buying pressure intraday will likely strengthen with a positive retest of 6930.5
- Selling pressure intraday will likely strengthen with a failed retest of 6910
- Resistance sits near 6932.75 to 6965.5 with 6974.5 and 6988.5 above that.
- Support sits between 6911.5 and 6892.5, with 6861.5 and 6844.5 below that.
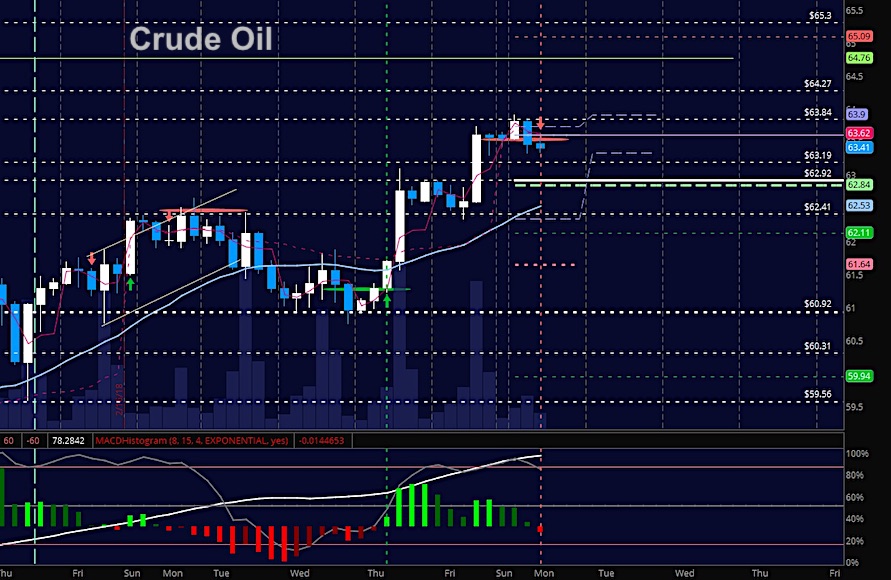
WTI Crude Oil
Early morning tests of resistance near 63.9 have allowed sellers to begin to force price back into higher support -potentially near 62.94 – a former breakout region. Price expansion should still be jagged so don’t chase your trades here. The bullets below represent the likely shift of intraday trading momentum at the positive or failed tests at the levels noted.
- Buying pressure intraday will likely strengthen with a positive retest of 63.95
- Selling pressure intraday will strengthen with a failed retest of 63.24
- Resistance sits near 63.7 to 63.95, with 64.27 and 64.76 above that.
- Support holds near 63.34 to 62.93, with 62.55 and 62.26 below that.
Twitter: @AnneMarieTrades
The author trades stock market futures every day and may have a position in mentioned securities at the time of publication. Any opinions expressed herein are solely those of the author, and do not in any way represent the views or opinions of any other person or entity.
: All Energy Hands on Deck!")


: All Energy Hands on Deck!")