Stock Market Futures Trading Considerations For December 7, 2017
The S&P 500 (INDEXSP:.INX) is retesting important price support on Wednesday morning. A successful retest could mean a more significant bounce for stock bulls. In the commentary below I break down the trading setups for S&P 500 and Nasdaq futures indices along with crude oil.
Note that you are invited to join us at the Schwab Live trading conference (in Dallas). We’ll be on a live show there – “It’s a Trader thing”.
You can access today’s economic calendar with a full rundown of releases.
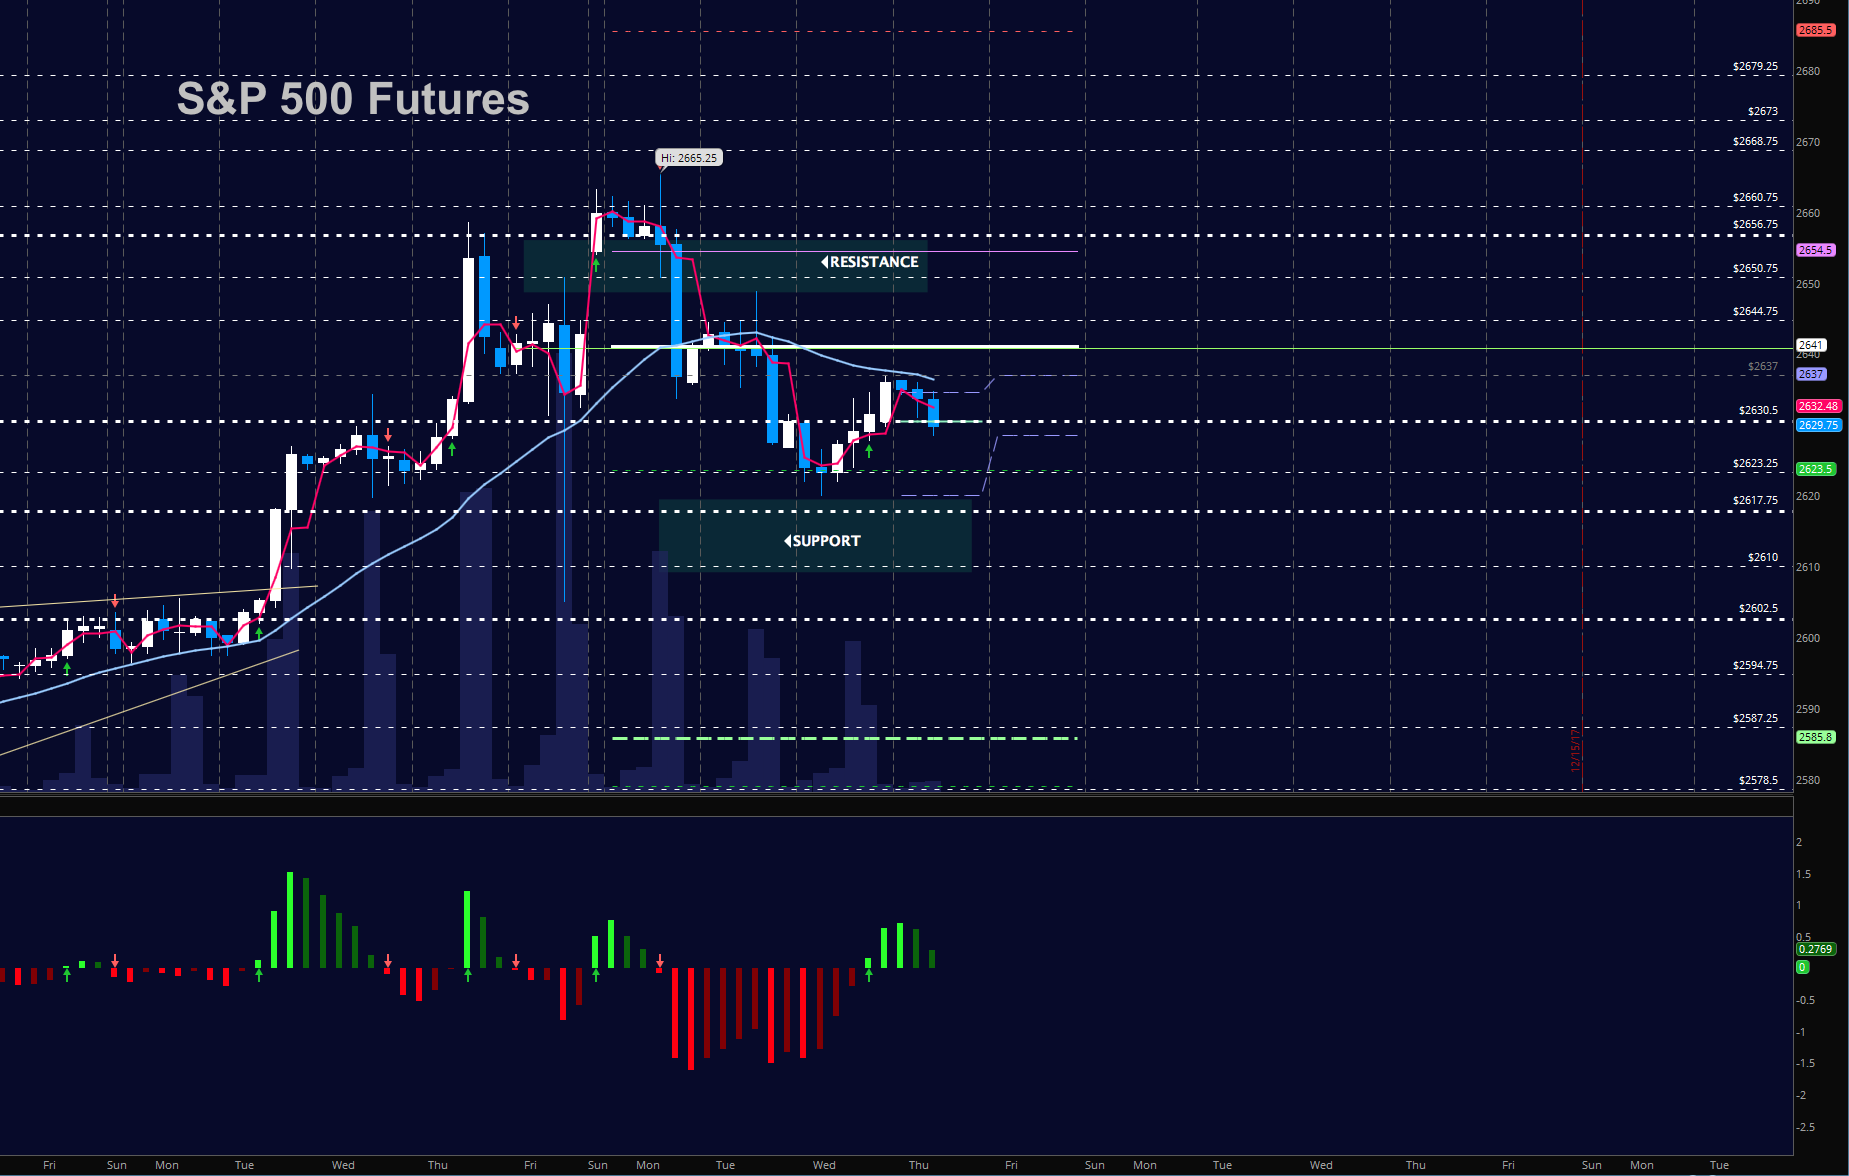
S&P 500 Futures
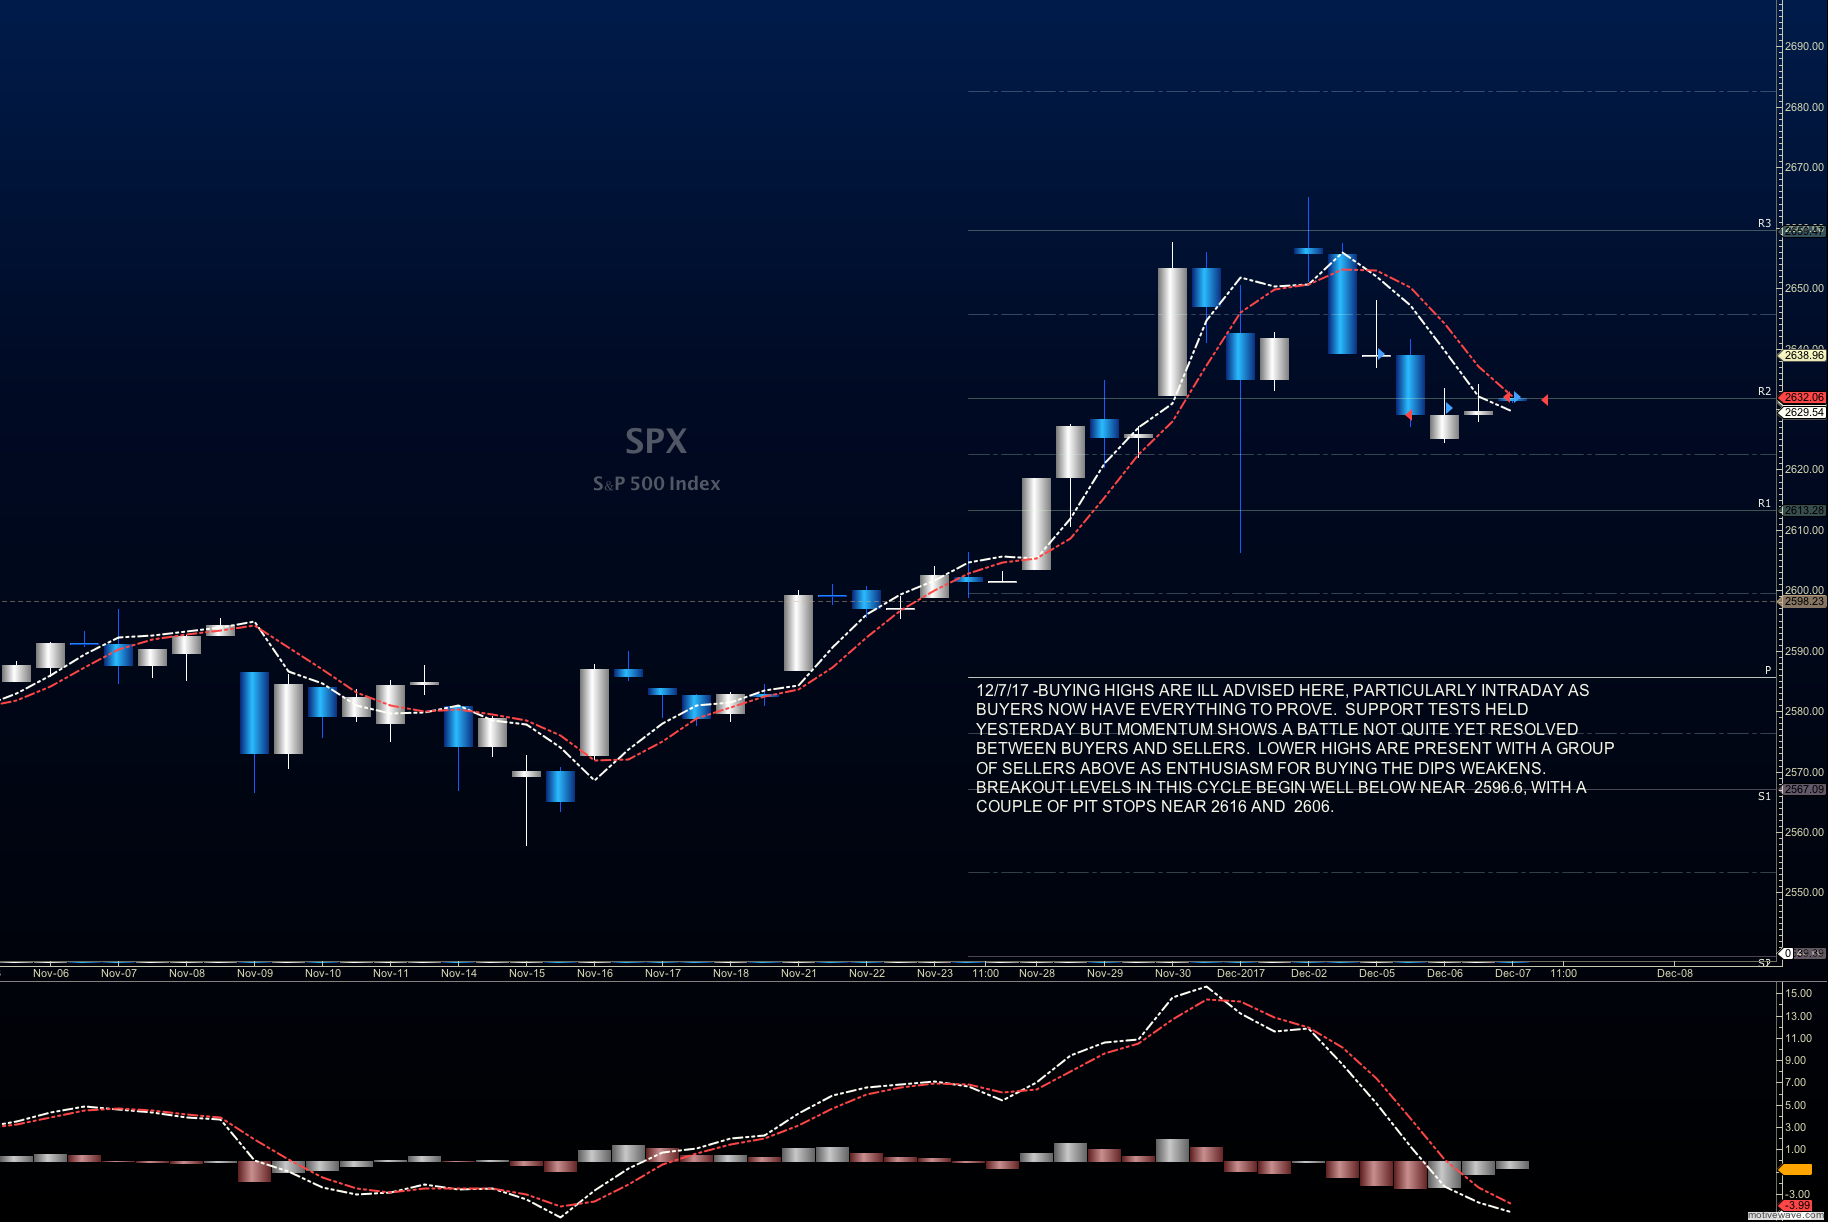
Buyers showed up yesterday but not with the force to which we have been accustomed. Lower highs are presenting with sellers above near 2637. Buyers are still on the hook to recapture momentum but charts look less than enthusiastic about buying. Price is currently chattering at congestion near 2630. The bullets below represent the likely shift of trading momentum at the positive or failed retests at the levels noted.
- Buying pressure intraday will likely strengthen with a positive retest of 2634.75
- Selling pressure intraday will likely strengthen with a failed retest of 2622.5
- Resistance sits near 2634.5 to 2641.5, with 2648.5 and 2654.5 above that.
- Support holds between 2619.5 and 2616.25, with 2609.5 and 2596.5 below that.
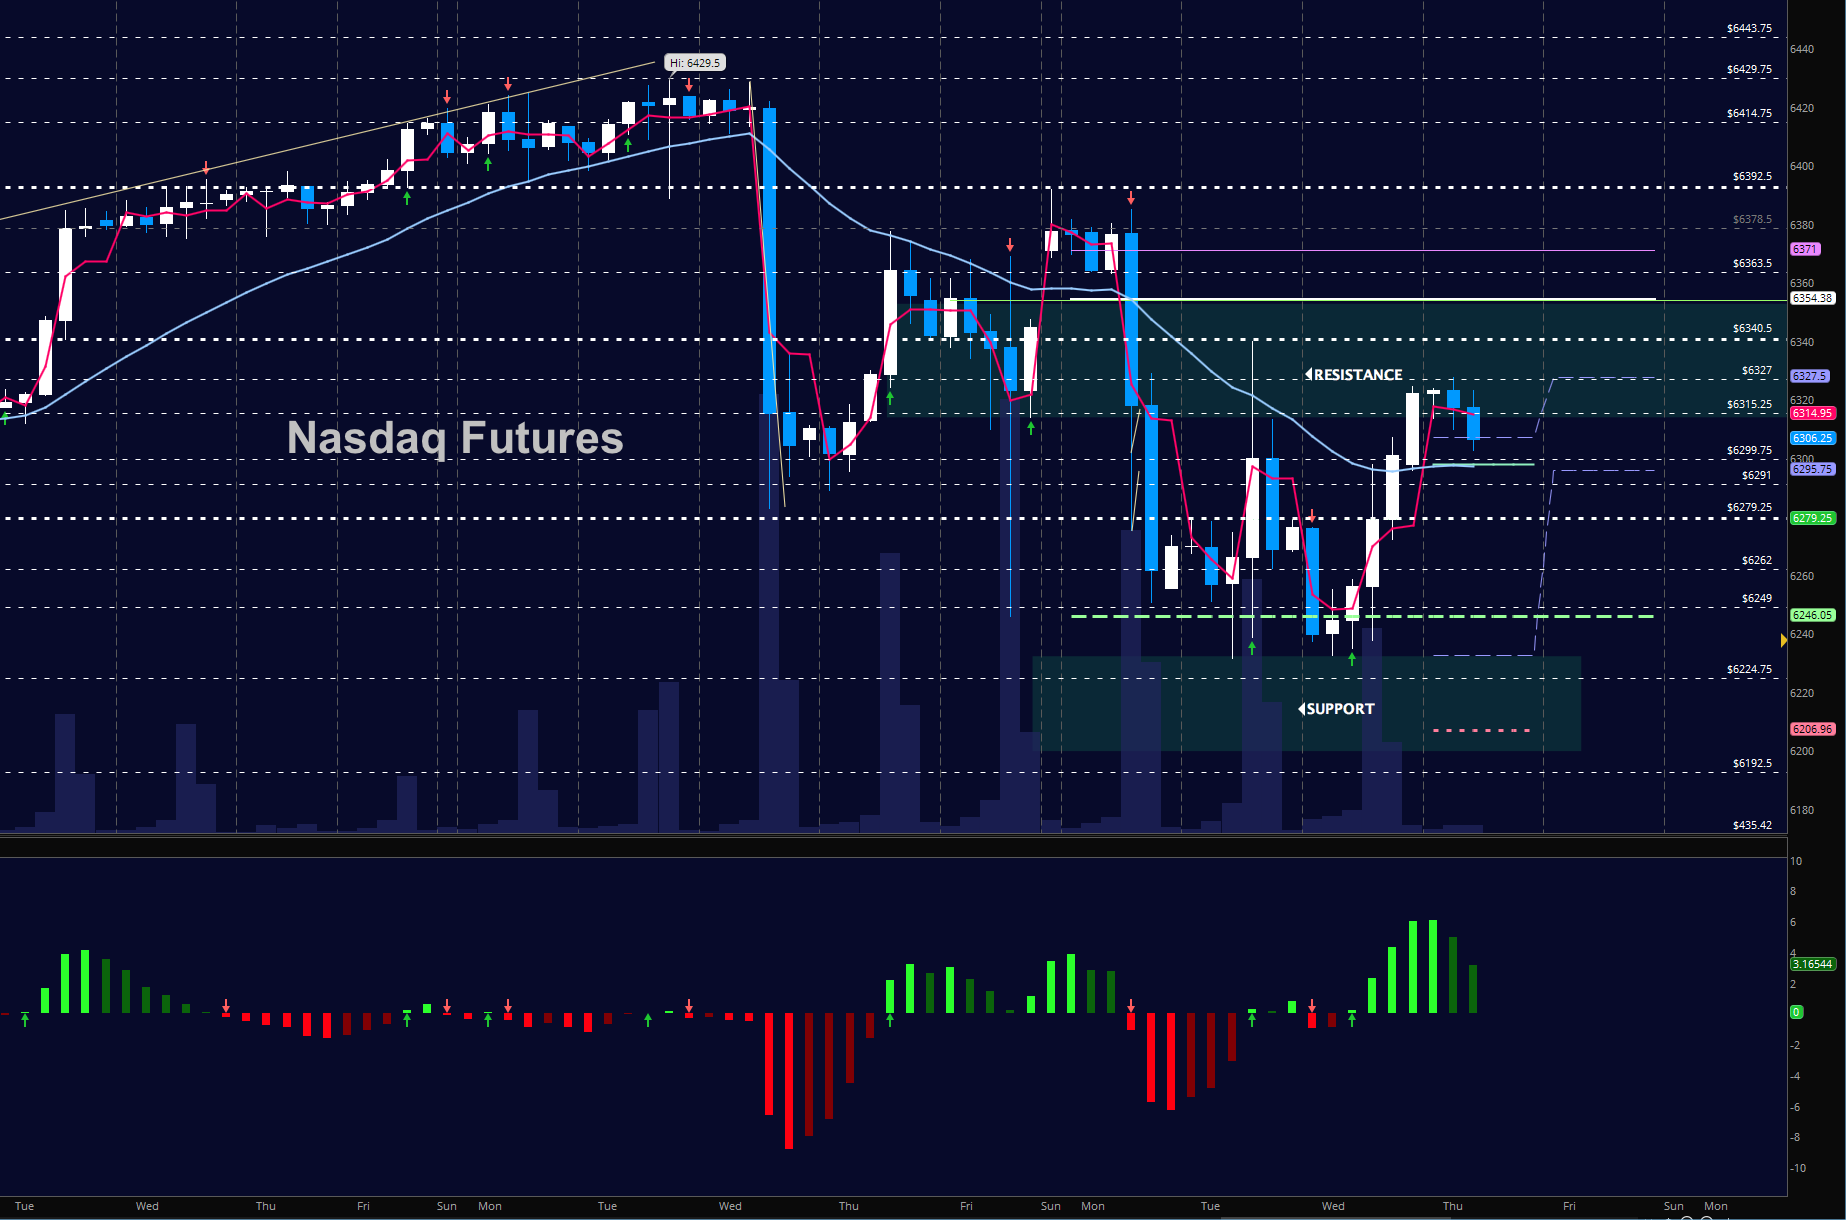
NASDAQ Futures
Traders are working through recovery from the dips for the last three days and are holding above 6290 – a key recovery zone we’ll have our eyes on today. Lower support tests held at the retrace into 6234 or so. Buyers set up a bounce as expected but they’ve stalled out since the move to old support that sits as new resistance around 6324. A breach here and buyers will be off to the races. The bullets below represent the likely shift of intraday trading momentum at the positive or failed tests at the levels noted.
- Buying pressure intraday will likely strengthen with a positive retest of 6324.5
- Selling pressure intraday will likely strengthen with a failed retest of 6293.5
- Resistance sits near 6327.5 to 6342 with 6354.75 and 6374.75 above that.
- Support holds near 6294.5 and 6272.75, with 6257.25 and 6231.75 below that.
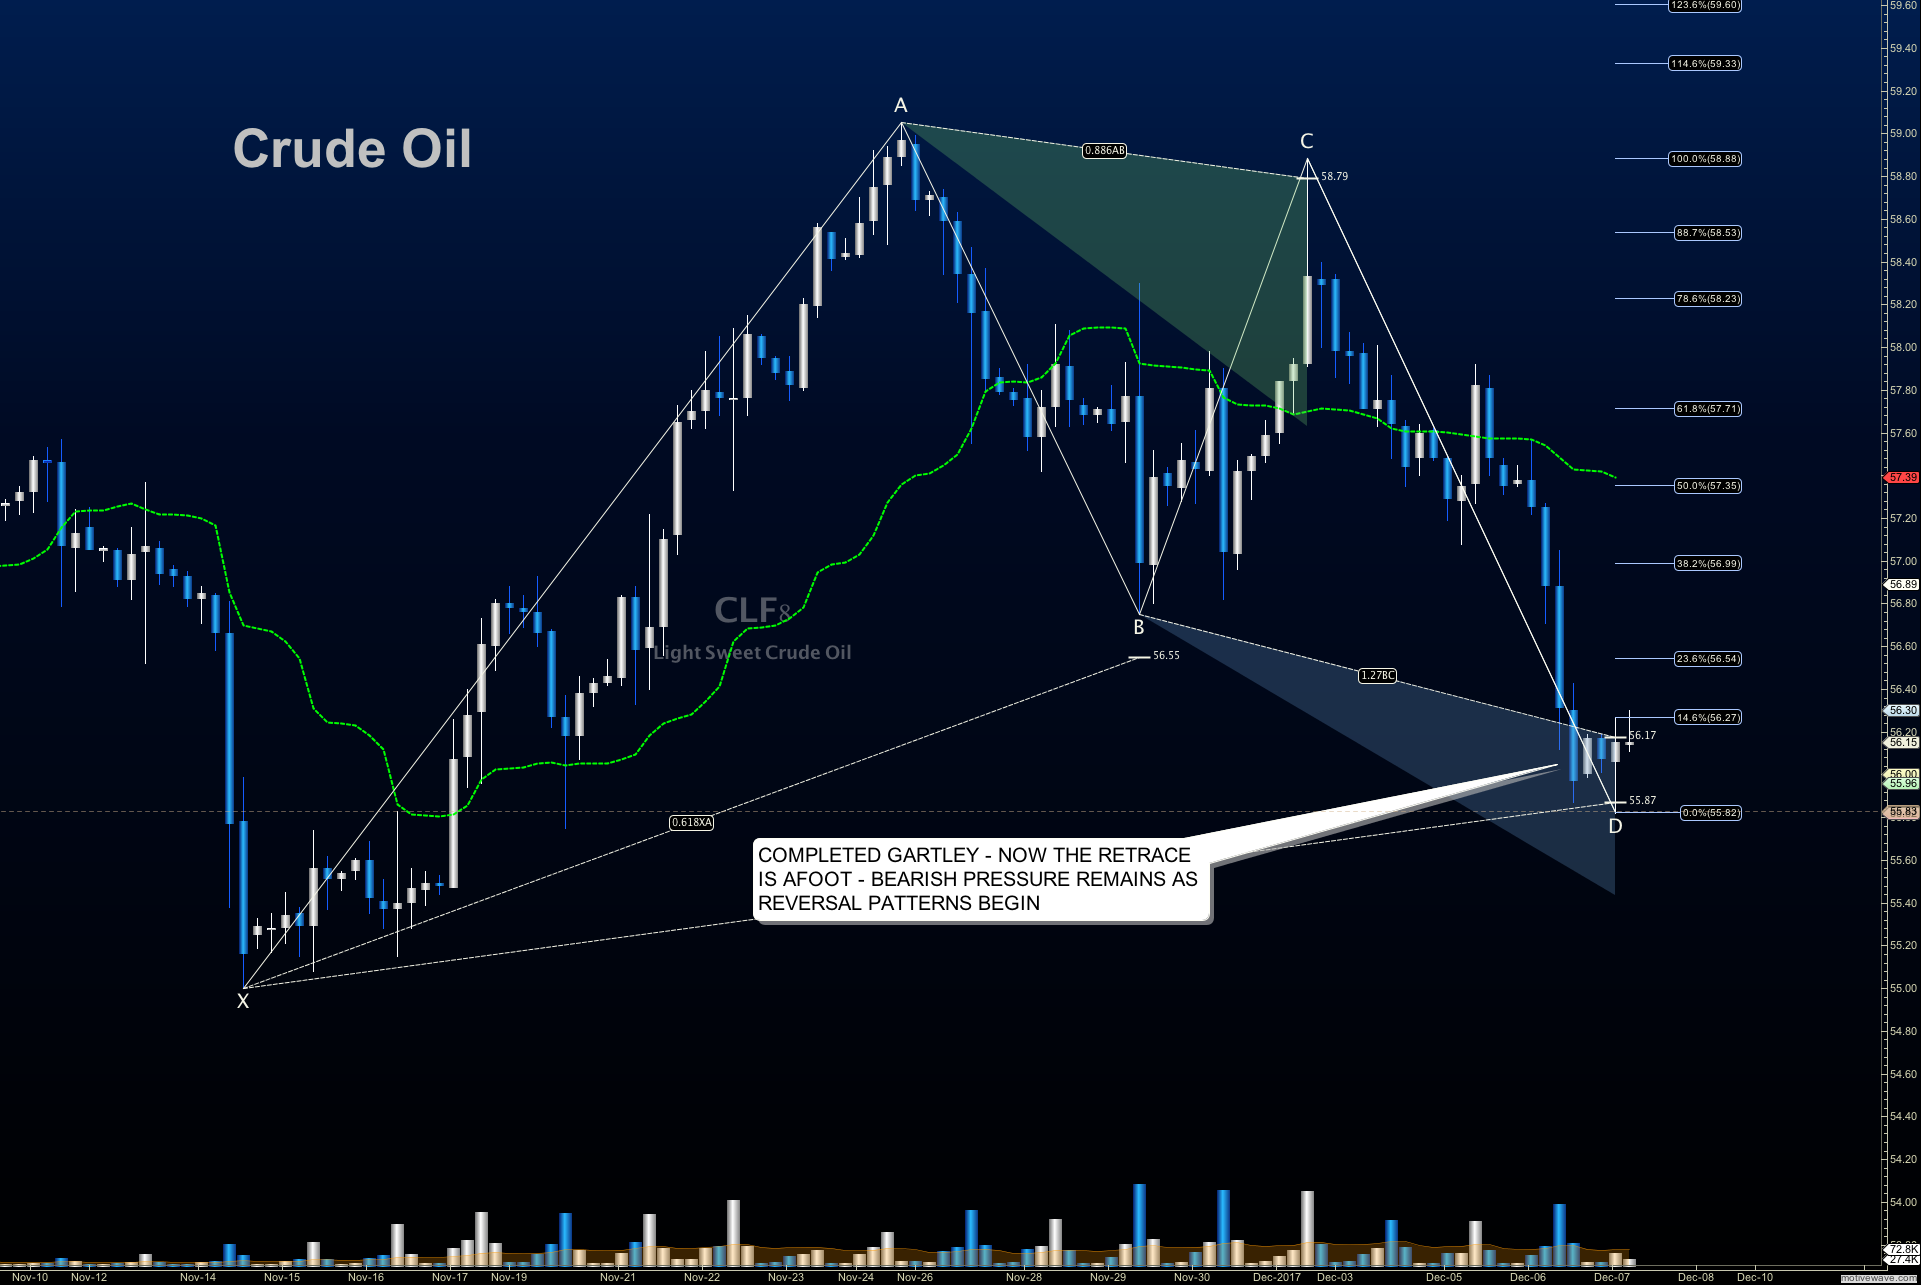
WTI Crude Oil
A tug of war wages around 56 as traders dipped below this level (not quite to our 55.75 area) and then recovered. We have a completed bullish Gartley but BUYERS HAVE A LOT TO PROVE here and sellers waiting at 56.3 continue to force them down into support. A loss of this level at 55.8 could give us a nasty drift into 55.39 and then 54.96. Traders weighted heavy long in the cycle have been in a stampede to close positions in the fade lower. The bullets below represent the likely shift of trading momentum at the positive or failed tests at the levels noted.
- Buying pressure intraday will likely strengthen with a positive retest of 56.34
- Selling pressure intraday will strengthen with a failed retest of 55.8
- Resistance sits near 56.3 to 56.9, with 57.1 and 57.89 above that.
- Support holds near 55.96 to 55.74, with 55.39 and 54.96 below that.
Twitter: @AnneMarieTrades
The author trades stock market futures every day and may have a position in mentioned securities at the time of publication. Any opinions expressed herein are solely those of the author, and do not in any way represent the views or opinions of any other person or entity.

: Creating Bullish Divergence?")

: Creating Bullish Divergence?")


