Broad Stock Market Futures Outlook for April 27, 2018
Bullish pressure has taken stock market futures into higher price resistance while holding higher lows. This suggests that buyers are trying to exercise pressure in the move.
A view of daily volume shows us that buying pressure is still weaker in general across the board, so cross-currents of motion continue. The Nasdaq is outperforming due to Amazon’s blowout earnings call. Pullbacks should be buying zones, but the failure to advance will sound the alert for exhaustion.
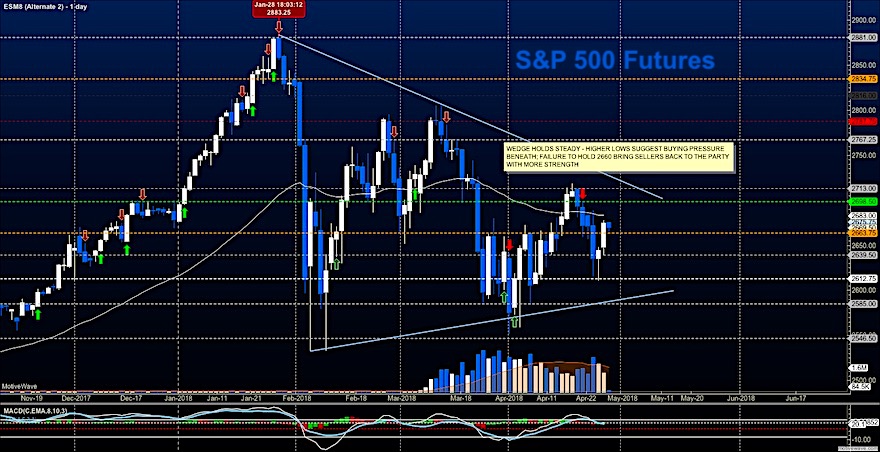
S&P 500 Futures
Bounces held above 2661 and resistance sits near familiar spaces. The higher line of contention sits near 2674-2676 where traders have been congesting this morning. Pullbacks should be buying zones as we near higher resistance. Expect candles to have significant wicks due to cross current action. The bullets below represent the likely shift of trading momentum at the positive or failed retests at the levels noted.
- Buying pressure intraday will likely strengthen with a bullish retest of 2676.75
- Selling pressure intraday will likely strengthen with a bearish retest of 2661.5
- Resistance sits near 2675.25 to 2684.75, with 2697.25 and 2713.75 above that.
- Support sits between 2670.5 and 2664.5, with 2654.5 and 2639.50
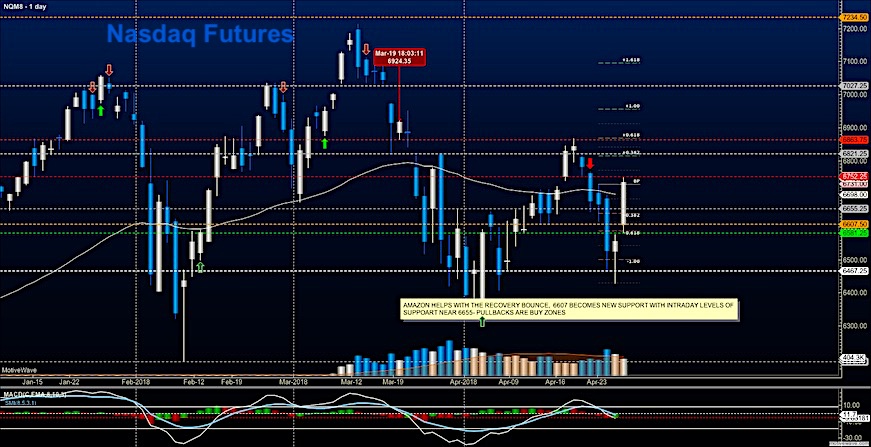
NASDAQ Futures
Amazon has this instrument roaring higher with resistance just ahead near 6754. Cautious trading into resistance continues (that means buying at pullbacks into support rather than at the breakouts). The bullets below represent the likely shift of intraday trading momentum at the positive or failed tests at the levels noted.
- Buying pressure intraday will likely strengthen with a bullish retest of 6754.75
- Selling pressure intraday will likely strengthen with a bearish retest of 6713
- Resistance sits near 6752.5 to 6797.25 with 6821.25 and 6869.75 above that.
- Support sits between 6724.5 and 6698.5, with 6654.5 and 6594.75 below that.
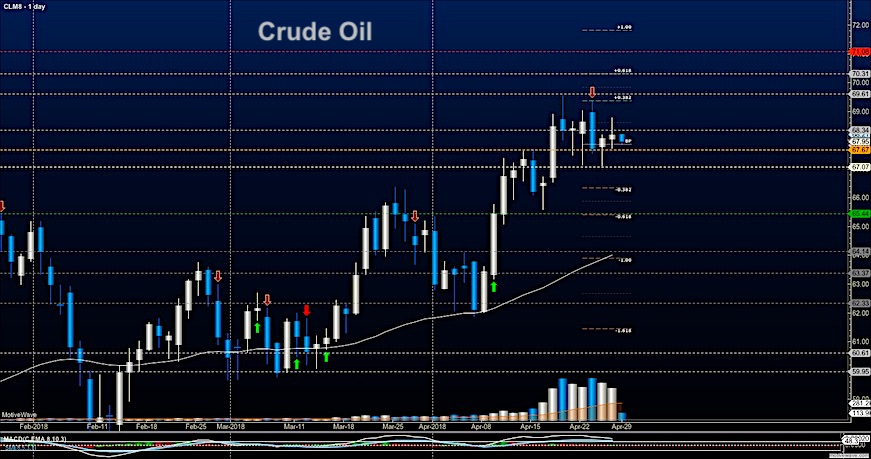
WTI Crude Oil
Traders have stalled above the breakout level at 67.7. Buyers are still attempting the push into near-term resistance around 69, but lower highs of the last couple of days signal a warning to me so I will be watching for support to fail for a test deeper. Bounces into resistance right now have sellers poised so short action there is favorable with tight stops. The bullets below represent the likely shift of intraday trading momentum at the positive or failed tests at the levels noted.
- Buying pressure intraday will likely strengthen with a bullish retest of 68.34
- Selling pressure intraday will strengthen with a bearish retest of 67.74
- Resistance sits near 68.78 to 69.45, with 69.87 and 70.22 above that.
- Support holds near 67.9 to 67.46, with 67.14 and 66.47 below that.
Twitter: @AnneMarieTrades
The author trades stock market futures every day and may have a position in mentioned securities at the time of publication. Any opinions expressed herein are solely those of the author, and do not in any way represent the views or opinions of any other person or entity.
: Creating Bullish Divergence?")


: Creating Bullish Divergence?")