Outlook for S&P 500 futures for May 20, 2016 – The chart came to within one tick of the weekly range assessment for support and bounced aggressively. We currently sit once again in morning congestion. Deeper support sits below at 2041.5, 2038.5, and 2032.5.
S&P 500 futures are clearly range bound and buyers are propping up the market at weak levels when they are most needed. The trouble is that the longer stock market futures expend energy lifting levels off lows, the more likely it is that buyers will exhaust. So far, that has not been the case but I am concerned about this eventually happening.
The price action is mixed with no clear winner showing currently for intraday movement, but I suspect bounces still get sold. If S&P 500 futures are able to breach 2047.75, buyers are more apt to the retrace upward back into resistance near 2053-2055, before sellers try to force buyers back down again. Lots of overhead supply exists, and the charts continue to look heavy. That said, we continue to hold lower support.
Momentum on the four-hour chart remains negative, but is lifting into resistance. Key support action is now shifted down into 2019 with a line of buyers near 2022-2025.5. The struggle for strength and continuation makes for range based trading – that means the edges will give you the best reward to risk trading event.
See today’s economic calendar with a rundown of releases.
THE RANGE OF TUESDAY’S MOTION
E-mini S&P 500 Futures (ES_F)
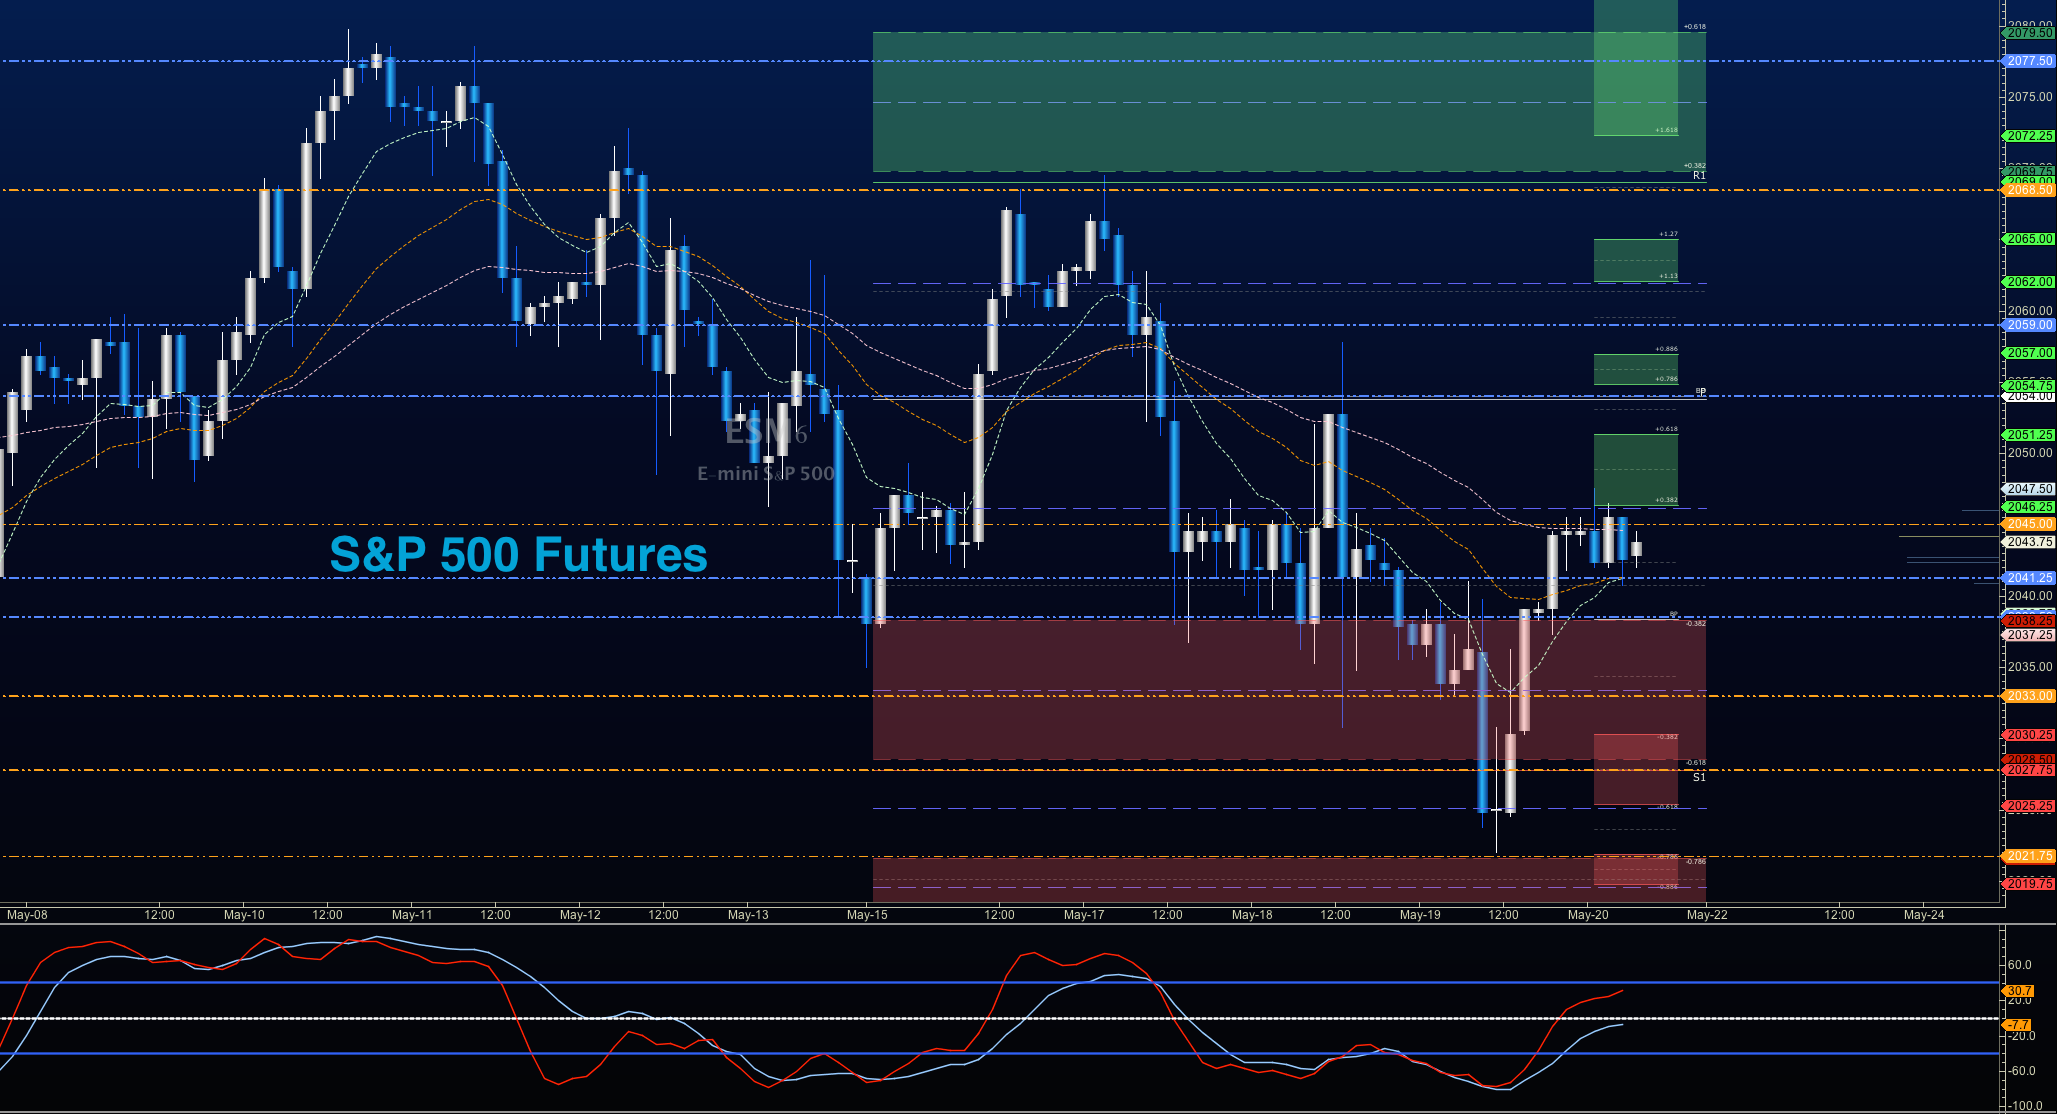
S&P 500 futures analysis for May 20, 2016 – Momentum sits with the sellers currently, but buyers have breached resistance for sure. We may be on the way to 2053.5 before the chart fades.
Upside trades on S&P 500 futures – Favorable setups sit on the positive retest of 2046.25, or a positive retest of 2038.5 with positive momentum. I use the 30min to 1hr chart for the breach and retest mechanic. Targets from 2038.5 are 2041.5, 2043.5, 2045, 2047.5, 2053.5, 2055, and if we can catch a bid there, we could expand into 2057.5 and 2061.75.
Downside trades on S&P 500 futures – Favorable setups sit below the failed retest of 2037.5 or at the failed retest of 2051 with negative divergence. It is important to watch for higher lows to develop with the 2051 entry as much consolidation would sit below if that occurred. Retracement into lower levels from 2051 gives us the targets 2047.5, 2043.25, 2041.5, 2038.5, 2034.5, 2031.25, 2029.5, 2026.5, and perhaps a retest near 2025 before bouncing. I do not see lower lows today, but that could change with several failed retests at 2038.5.
Crude Oil Futures (CL_F)
Outlook for Crude Oil for May 20, 2016 – We saw a huge bounce yesterday that looked a lot like squeeze behavior to me – traders were short and having stops run, then catching a bid into the upside action.
The trading range on crude oil suggests support action near 48.45, and resistance behavior near 49.76.
Upside trades for crude oil futures can be staged on the positive retest of 48.89, or after a deep dip into 48.65, but carefully watch for a lower high to develop with that deep drift. I often use the 30min to 1hr chart for the breach and retest mechanic. Targets from 48.4 are 48.65, 48.8, 49.09, 49.29, 49.48, 49.6, and if we can catch a bid there, we could expand into 49.78, and 50.03 to 50.92. Next week’s API report and EIA report may likely be affected by Nigeria disruption, and will certainly weigh on price action.
Downside trades on crude oil continue to setup well below failed retests – I was looking for negative divergence and a failed retest of 49.24 (see yesterday’s downside trades here), but that did not come until late last night, but as expected, the fade set in nicely in a very high probability trade. The chart here is roiling in a mix between buyers and sellers with specific ideas about where price should be. I continue to trade on what I perceive as the edges of the current formations. So the failed bounce off 48.4, or the failure at the retrace of 49.12 under negative divergence gives us the trade. Retracement into lower levels from 49.12 give us the targets 49.02, 48.89, 48.67, 48.45, 48.38, 48.17, 47.76, 47.42, 47.26, and perhaps 47.04, 46.76, and 46.44.
If you’re interested in the live trading room, it is now primarily stock market futures content, though we do track heavily traded stocks and their likely daily trajectories as well – we begin at 9am with a morning report and likely chart movements along with trade setups for the day.
As long as the trader keeps himself aware of support and resistance levels, risk can be very adequately managed to play in either direction as bottom picking remains a behavior pattern that is developing with value buyers and speculative traders.
Twitter: @AnneMarieTrades
The author trades stock market futures every day and may have a position in mentioned securities at the time of publication. Any opinions expressed herein are solely those of the author, and do not in any way represent the views or opinions of any other person or entity.


