Stock Market Futures Considerations For October 31, 2017
The S&P 500 (INDEXSP:.INX) and Nasdaq (INDEXNASDAQ:.IXIC) are trading mixed on Tuesday morning. Trading ranges are narrowing so a move of greater trading significance may be in the offing. Stay alert and watch your levels!
Check out today’s economic calendar with a full rundown of releases. And note that the charts below are from our premium service and shared exclusively with See It Market readers.
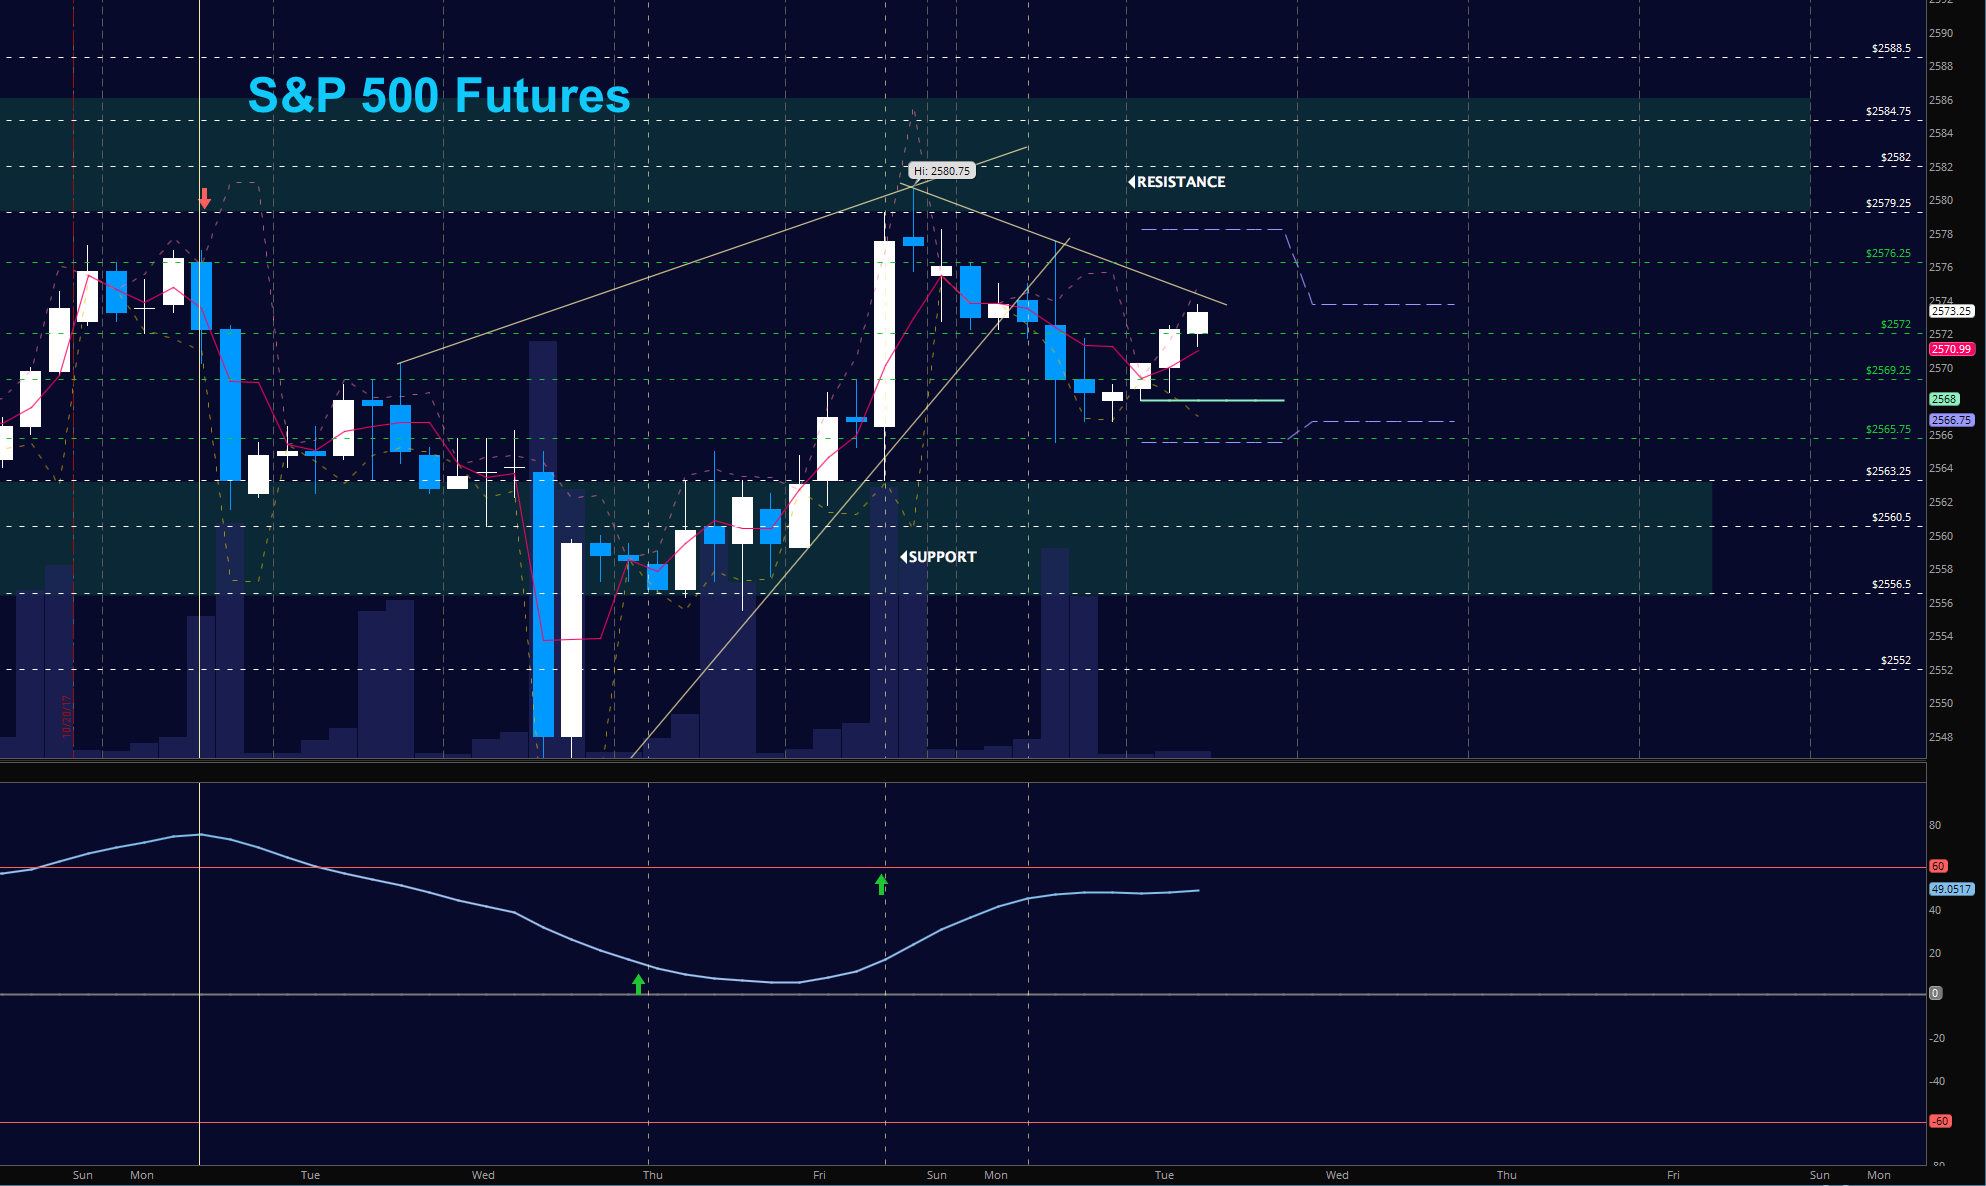
S&P 500 Futures
Traders advanced prices into LOWER HIGHS this morning with HIGHER LOWS after a drift into support yesterday. The hold above 2577.75 gives the buyers control to advance but better trades are always at the pullbacks into support zones. Pullbacks are still likely to find buyers as momentum is bullish. The bullets below represent the likely shift of trading momentum at the positive or failed retests at the levels noted.
- Buying pressure intraday will likely strengthen above a positive retest of 2577.75
- Selling pressure intraday will likely strengthen with a failed retest of 2565.5
- Resistance sits near 2576.25 to 2579.25, with 2580.75 and 2584.75 above that.
- Support holds between 2568.75 and 2565.5, with 2563.5 and 2560.5 below that.
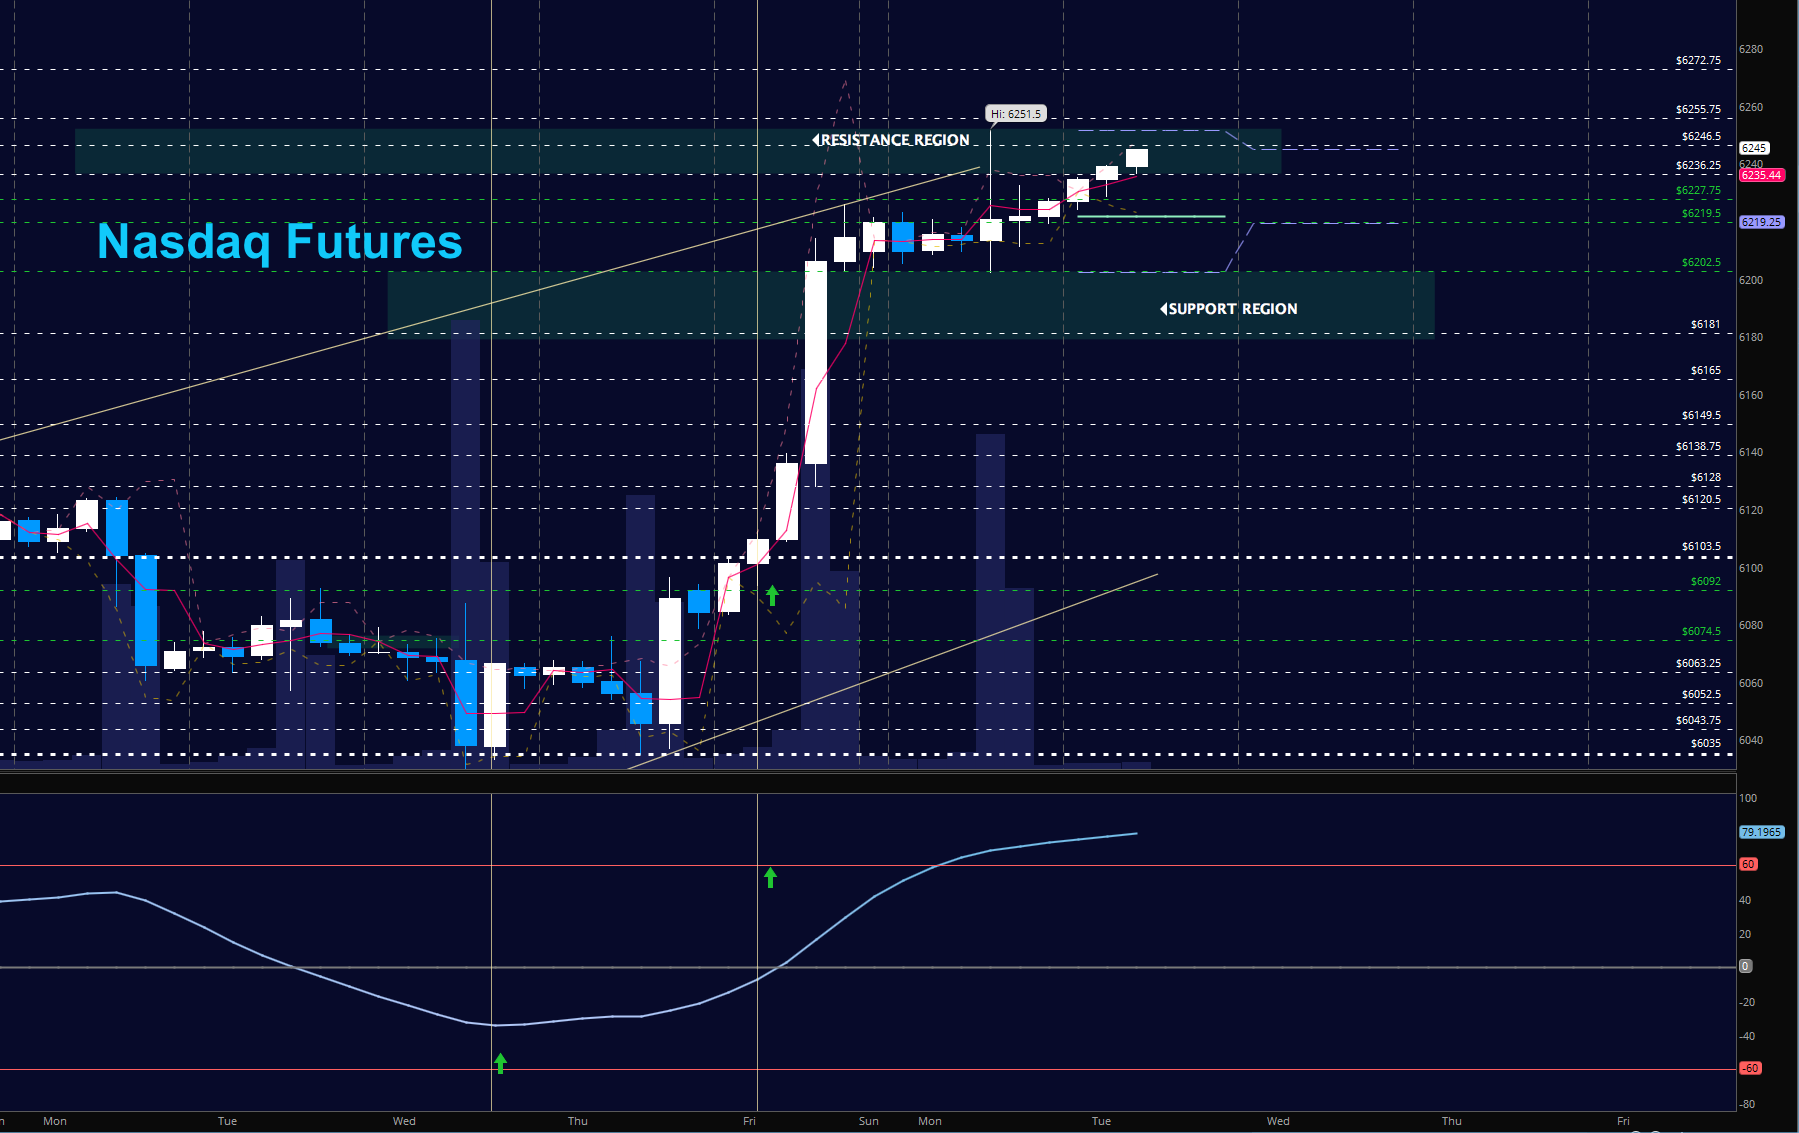
NASDAQ Futures
The NQ continued into HIGHER HIGHS and HIGHER LOWS but faded off the breakout levels once again Holding 6194.75 keeps buyers in firm control. We are over 100 points from our last region of heavy support action so watching new higher support to hold will be critical to managing risk. The bullets below represent the likely shift of intraday trading momentum at the positive or failed tests at the levels noted.
- Buying pressure intraday will likely strengthen with a positive retest of 6236.75
- Selling pressure intraday will likely strengthen with a failed retest of 6219
- Resistance sits near 6236.25 to 6245.75 with 6255.75 and 6272.75 above that.
- Support holds between 6219.5 and 6202.5, with 6194.75 and 6163.75 below that.
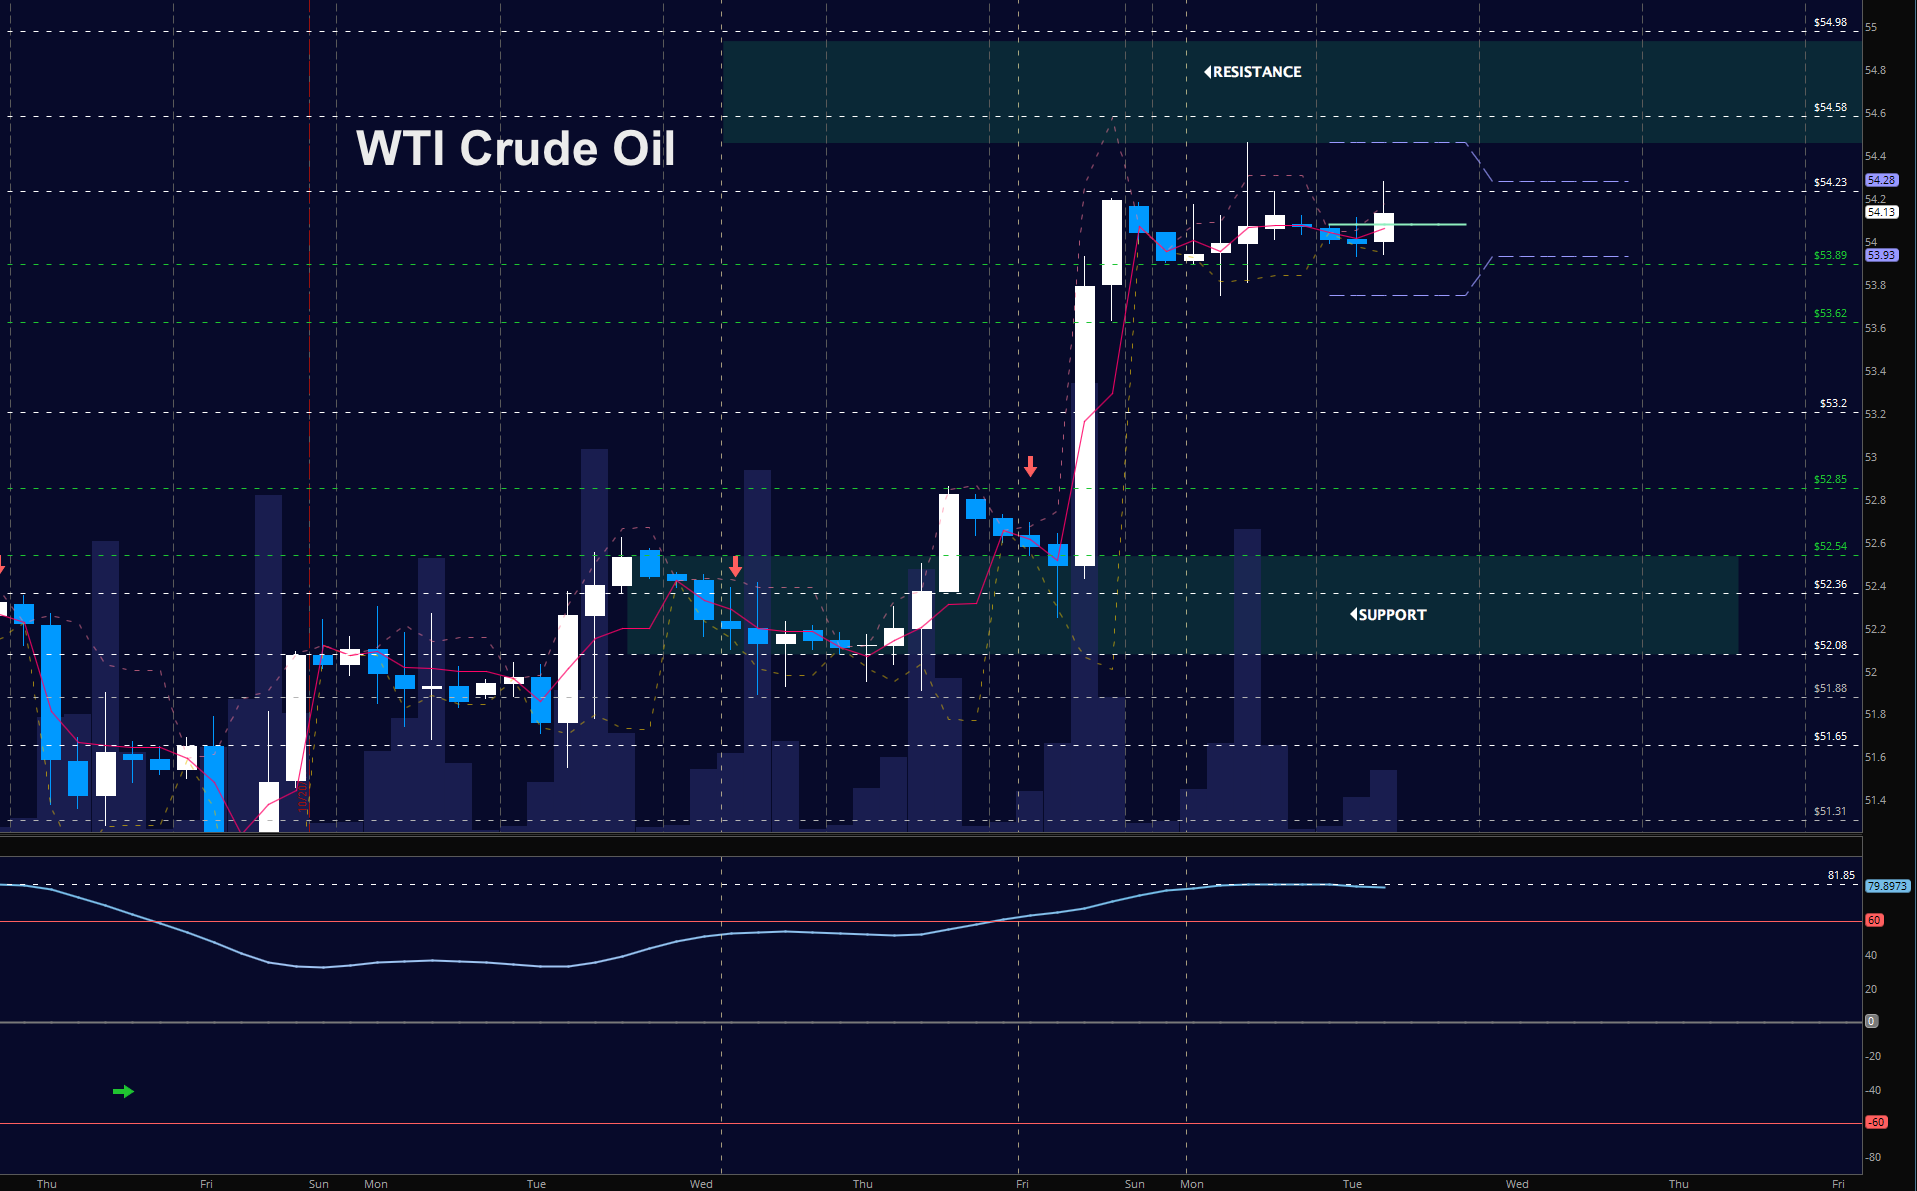
WTI Crude Oil
Oil held steady with SIDEWAYS & RANGE BOUND motion. Momentum is still bullish but we have tested the 54.3 area for three days. Pullbacks, however deep, will come into value buyers waiting to head higher in the current formation. As long as the chart holds 52.85, buyers will keep the stronghold they currently have. The bullets below represent the likely shift of trading momentum at the positive or failed tests at the levels noted.
- Buying pressure intraday will likely strengthen with a positive retest of 54.32
- Selling pressure intraday will strengthen with a failed retest of 53.62
- Resistance sits near 54.28 to 54.58, with 54.98 and 55.48 above that.
- Support holds between 53.62 to 53.2, with 52.85 and 52.36 below that.
If you’re interested in the live trading room, it is now primarily stock market futures content, though we do track heavily traded stocks and their likely daily trajectories as well – we begin at 9am with a morning report and likely chart movements along with trade setups for the day.
As long as the trader keeps himself aware of support and resistance levels, risk can be very adequately managed to play in either direction as bottom picking remains a behavior pattern that is developing with value buyers and speculative traders.
Twitter: @AnneMarieTrades
The author trades stock market futures every day and may have a position in mentioned securities at the time of publication. Any opinions expressed herein are solely those of the author, and do not in any way represent the views or opinions of any other person or entity.


 May Tip Stock Market’s Next Move")