Broad Stock Market Futures Outlook for April 13, 2018
Charts sit at the top of resistance range today with momentum holding steady to the upside. How well we manage this breakout will tell us whether we are able to maintain upside.
Earnings season begins and as mentioned yesterday, we expect to see these edges tested and expanded (translation – careful with reversal trades), but after expansion, we should collapse into congestion once more. This was my estimation for the second quarter – range bound in general but providing enough movement for the short-term trader to profit.
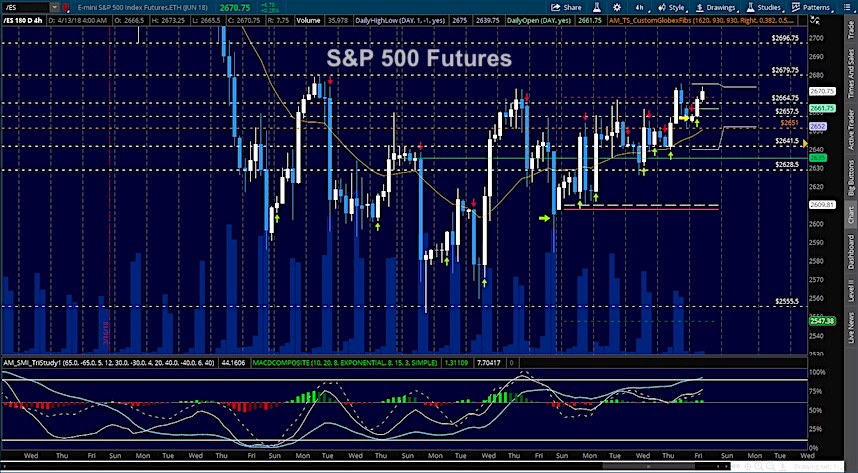
S&P 500 Futures
Support is at higher lows once more near 2651 with a familiar line in the sand near 2657.5. Our intraday drift remains positive so pullbacks are likely to be buying regions for traders. Sellers will have much more control if we fail to hold the region near 2672. The bullets below represent the likely shift of trading momentum at the positive or failed retests at the levels noted.
- Buying pressure intraday will likely strengthen with a bullish retest of 2682.75
- Selling pressure intraday will likely strengthen with a bearish retest of 2664.50
- Resistance sits near 2672.75 to 2679.75, with 2687.25 and 2697.75 above that.
- Support sits between 2669.75 and 2657.5, with 2648.75 and 2636.50
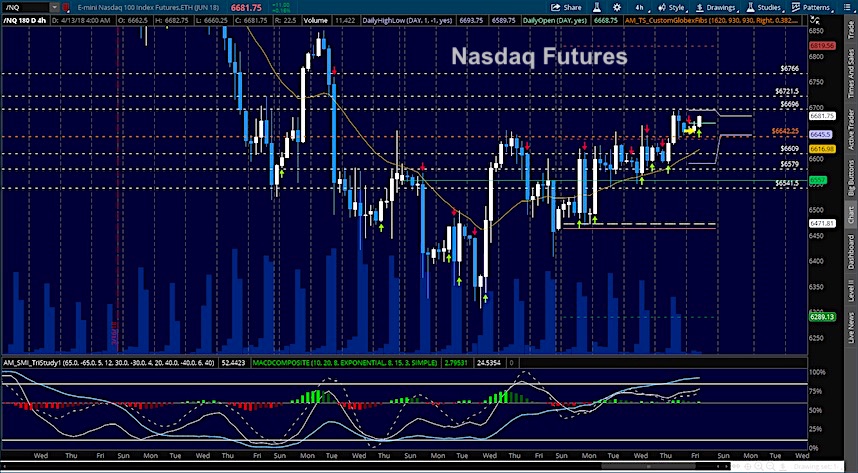
NASDAQ Futures
Momentum is bullish as traders push us higher towards resistance around 6721. Pullbacks will be buying zones. Holding 6674 will be important to buyers today. Resistance is being tested here near 6705 and should fade into higher lows at the first pass. The bullets below represent the likely shift of intraday trading momentum at the positive or failed tests at the levels noted.
- Buying pressure intraday will likely strengthen with a bullish retest of 6697.75
- Selling pressure intraday will likely strengthen with a bearish retest of 6645
- Resistance sits near 6709.5 to 6721.5 with 6766.5 and 6825.25 above that.
- Support sits between 6694.5 and 6672.75, with 6645.5 and 6589.75 below that.
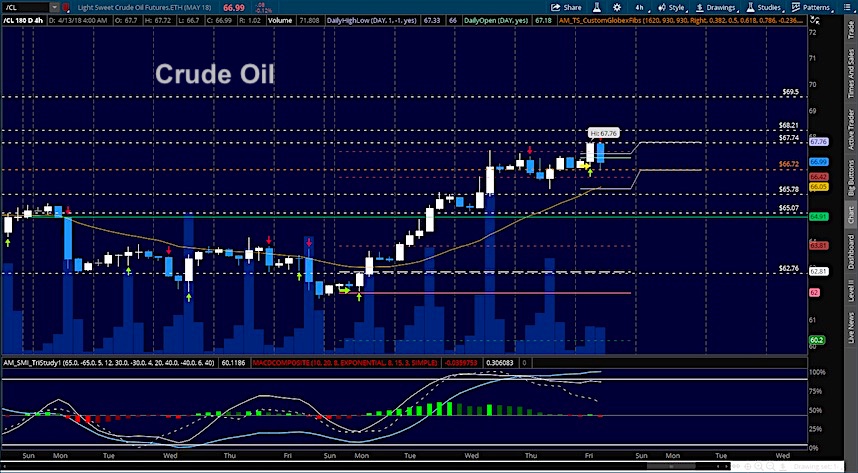
WTI Crude Oil
Bullish traders remain in charge as we hold the levels into resistance near new highs and just above 67. Bullish pressure is present and pullbacks to support on the first pass will be buying zones but, as yesterday, we are also potentially at the tipping point for the highs as they retest. Watch support as well as the failure to make new highs as caution signals for traders. The bullets below represent the likely shift of intraday trading momentum at the positive or failed tests at the levels noted.
- Buying pressure intraday will likely strengthen with a bullish retest of 67.18
- Selling pressure intraday will strengthen with a bearish retest of 66.86
- Resistance sits near 67.44 to 67.76, with 68.21 and 68.7 above that.
- Support holds near 66.7 to 66.42, with 66.07 and 65.79 below that.
Twitter: @AnneMarieTrades
The author trades stock market futures every day and may have a position in mentioned securities at the time of publication. Any opinions expressed herein are solely those of the author, and do not in any way represent the views or opinions of any other person or entity.


")


