Broad Stock Market Outlook for March 5, 2018
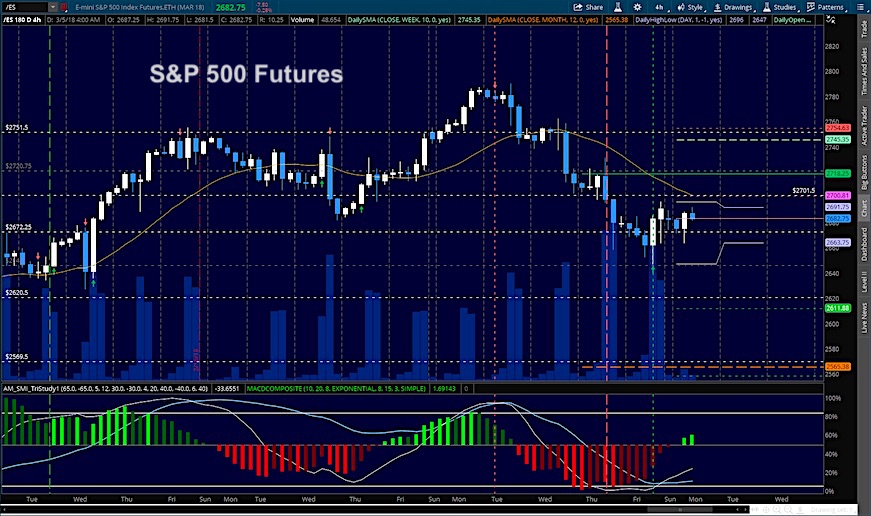
Bounces are in play here across all the indices this morning and though we begin below the close of Friday, we expect the lows to hold near 2662. Key resistance sits near 2702 – how well we do there will determine whether we move up and hold or break down and fail to recover.
S&P 500
Support holds at 2672.5 for now. Failure to break and hold above 2702.75 will likely send us into a range of motion near our lows near 2662. The bullets below represent the likely shift of trading momentum at the positive or failed retests at the levels noted.
- Buying pressure intraday will likely strengthen with a positive retest of 2691.75
- Selling pressure intraday will likely strengthen with a failed retest of 2658
- Resistance sits near 2687.75 to 2796.5, with 2702 and 2721.5 above that.
- Support sits between 2662.5 and 2646.5, with 2633.25 and 2620.5 below that.
NASDAQ Futures
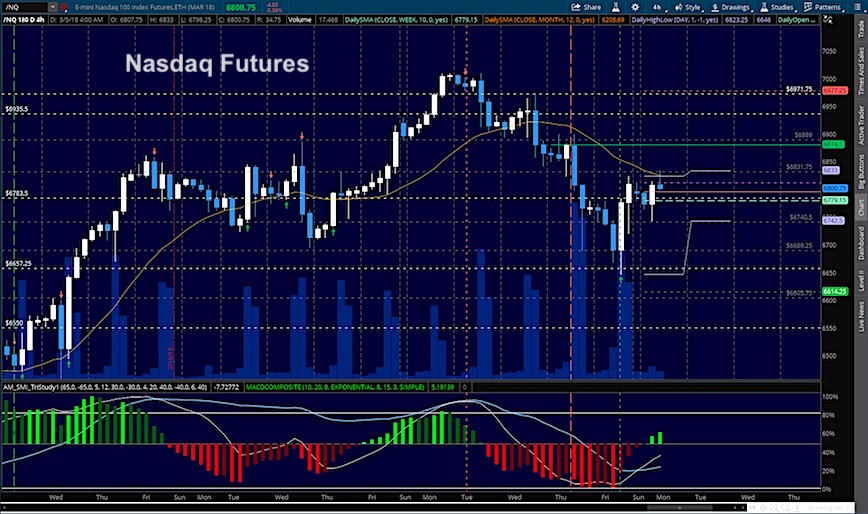
Bounce patterns are also in play here from an intraday perspective. Support today sits higher near 6740. Sellers are still in charge of the charts for now with bounces providing ideal spaces to take short trades BUT today we need to watch for higher lows and diminishing returns as our resistance stretches higher. These are patterns that show up in reversal spaces. Buyers will need to take us back above 6836.75 and hold, else we will set our eyes on 6778 as support tests on the horizon and lower. The bullets below represent the likely shift of intraday trading momentum at the positive or failed tests at the levels noted.
- Buying pressure intraday will likely strengthen with a positive retest of 6836.5
- Selling pressure intraday will likely strengthen with a failed retest of 6778
- Resistance sits near 6831.75 to 6879.5 with 6895.5 and 6932.5 above that.
- Support sits between 6778.5 and 6742.75, with 6712.5 and 6688.75 below that.
WTI Crude Oil
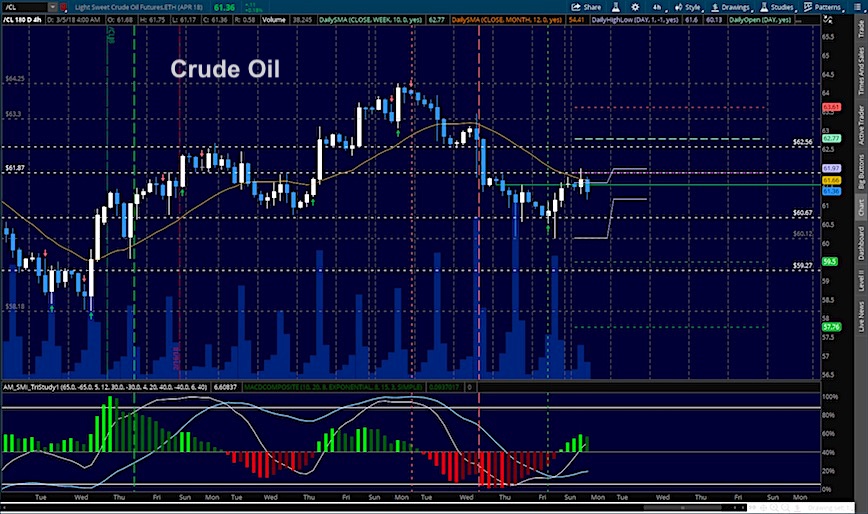
Deep support provided a bounce zone for traders looking for oil to lift but shale production still exercises pressure on this chart. Congestion still holds between 60.15 and 62.78. Bearish undercurrents still show so bounces are likely to be met by sellers at the first pass BUT holding higher support will show a directional shift. The bullets below represent the likely shift of intraday trading momentum at the positive or failed tests at the levels noted.
- Buying pressure intraday will likely strengthen with a positive retest of 62.12
- Selling pressure intraday will strengthen with a failed retest of 60.96
- Resistance sits near 61.97 to 62.26, with 62.78 and 63.34 above that.
- Support holds near 61.22 to 60.94, with 60.6 and 59.96 below that.
Twitter: @AnneMarieTrades
The author trades stock market futures every day and may have a position in mentioned securities at the time of publication. Any opinions expressed herein are solely those of the author, and do not in any way represent the views or opinions of any other person or entity.


