S&P 500 Futures Trading Chart (as of June 23)
Catching moves is important for active investors.
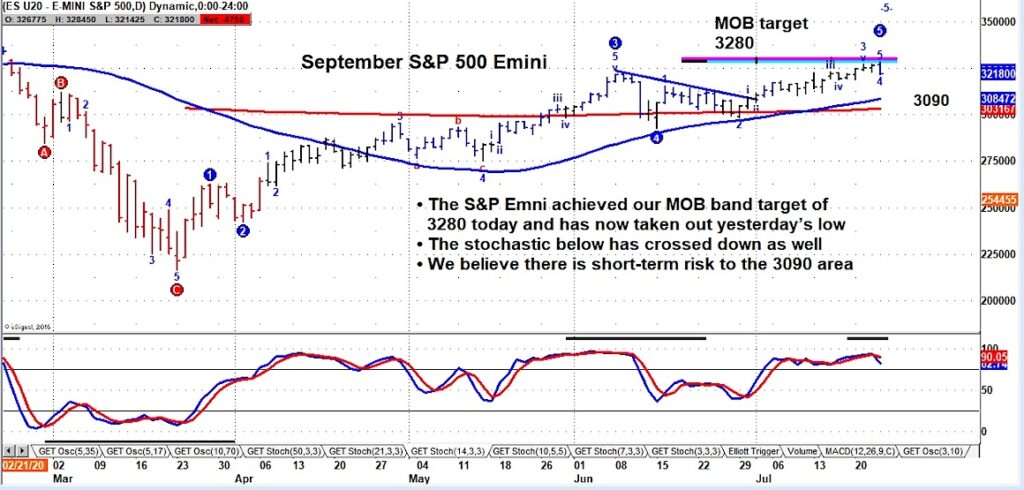
In the case of S&P 500 futures, Thursday’s reversal was a bearish short-term indicator (for traders).
The key stock market index hit our MOB band target at 3280 before reverses lower and taking out the prior day’s lows. That tells us that there may be more downside near term.
Trading price support resides at 3090 and that area may become a magnet / target for this pullback.
The author may have a position in mentioned securities at the time of publication. Any opinions expressed herein are solely those of the author, and do not in any way represent the views or opinions of any other person or entity.


