Broad Stock Market Futures Outlook for March 28, 2018
As mentioned yesterday, holding higher support lost would color the day and we did drift lower – for the NQ, we broke the lows but recovered from them – while the ES_F and YM_F held their Sunday lows.
We continue to be in a support watch formation.
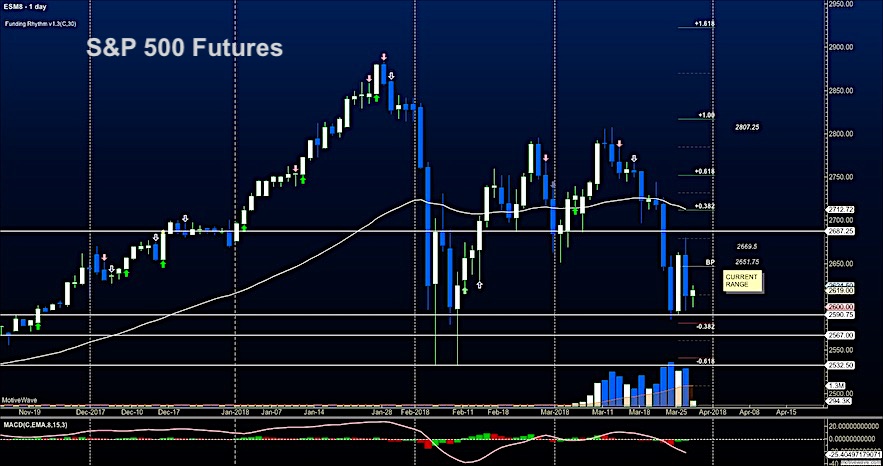
S&P 500 Futures
Weekly support near 2600 held as the chart broke well below our higher support zones retracing much of the motion of the prior day’s bounce. Traders are uncertain about the direction of continuation and are trading within ranges. The bullets below represent the likely shift of trading momentum at the positive or failed retests at the levels noted.
- Buying pressure intraday will likely strengthen with a bullish retest of 2622.50
- Selling pressure intraday will likely strengthen with a bearish retest of 2611.50
- Resistance sits near 2619.5 to 2634.75, with 2651.25 and 2679.75 above that.
- Support sits between 2600.25 and 2590.75, with 2567.5 and 2538.50.
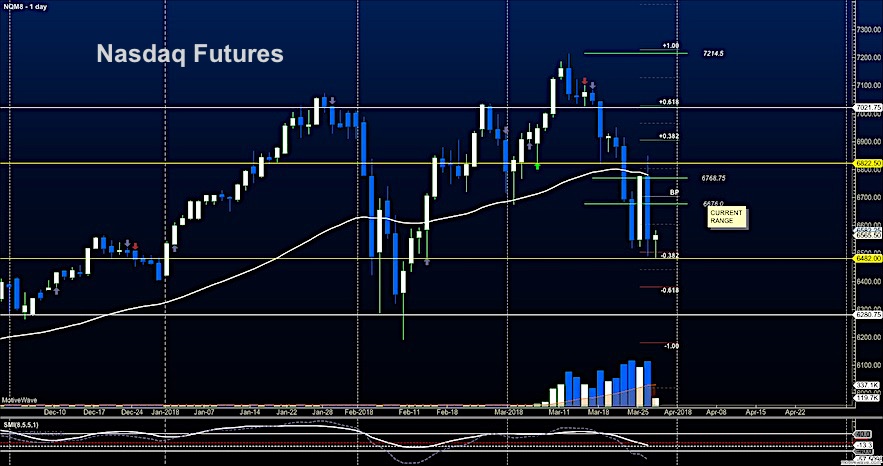
NASDAQ Futures
Bounces here remain weak as support holds near 6540. The charts have broken below but recover. Holding above 6616 will be important in order for buyers to attempt recovery. The bullets below represent the likely shift of intraday trading momentum at the positive or failed tests at the levels noted.
- Buying pressure intraday will likely strengthen with a bullish retest of 6615.50
- Selling pressure intraday will likely strengthen with a bearish retest of 6560.50
- Resistance sits near 6586.5 to 6606.5 with 6670.5 and 6767.5 above that.
- Support sits between 6567.75 and 6527.75, with 6504.25 and 6587.5 below that.
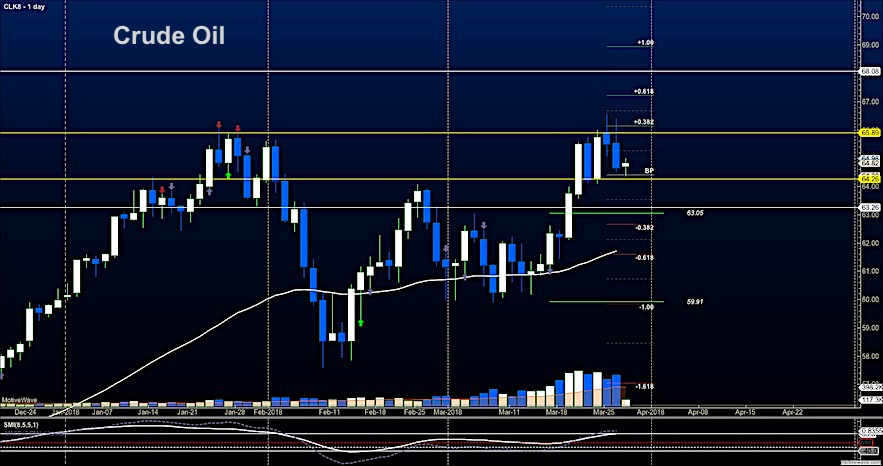
WTI Crude Oil
EIA this morning as traders sell the current contract off into support near 64.3. This will be the area to watch today. The region near 64.3 should hold as support else we are likely to see 63.3. Support watches are on tap as they were yesterday as losing support signals a potential sea change in our bullish environments. The bullets below represent the likely shift of intraday trading momentum at the positive or failed tests at the levels noted.
- Buying pressure intraday will likely strengthen with a bullish retest of 65.19
- Selling pressure intraday will strengthen with a bearish retest of 64.30
- Resistance sits near 64.96 to 65.17, with 65.89 and 66.5 above that.
- Support holds near 64.26 to 64.01, with 63.76 and 63.26 below that.
Twitter: @AnneMarieTrades
The author trades stock market futures every day and may have a position in mentioned securities at the time of publication. Any opinions expressed herein are solely those of the author, and do not in any way represent the views or opinions of any other person or entity.


")


