Broad Stock Market Futures Trading Outlook for May 21, 2018
Charts have lifted significantly from their close on Friday with news of the US-China trade war on hold. We are, however, not pressing upward from the first spike upward so my eyes will be on the support zones.
A gap fill (a fade of price through low volume/no volume regions) could be very much a possibility.
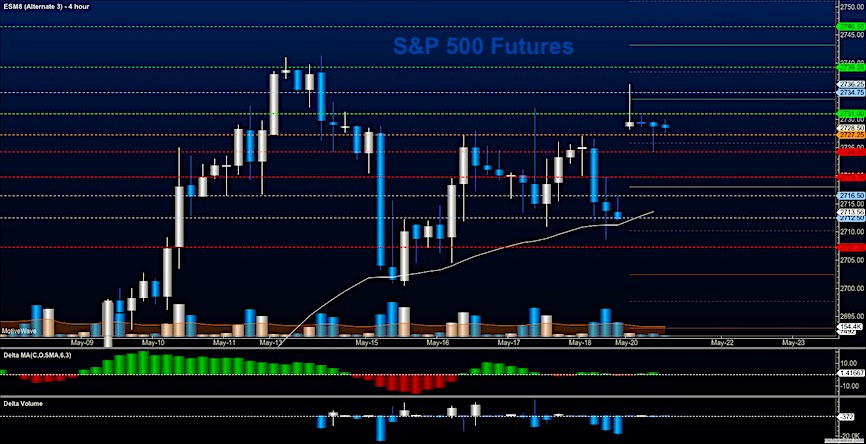
S&P 500 Futures
This chart is tightly bound for now between 2727 and 2731 with wicks on either side- Above 2728, traders should attempt the breach of 2731 and into higher resistance. The traders look fairly lackluster here so it may be a narrow range day given the participation. Watch those edges. The bullets below represent the likely shift of trading momentum at the successful or failed retests at the levels noted.
- Buying pressure intraday will likely strengthen with a bullish retest of 2728.75
- Selling pressure intraday will likely strengthen with a bearish retest of 2724
- Resistance sits near 2731. to 2734.75, with 2739.75 and 2746.5 above that.
- Support sits between 2727 and 2719.5, with 2713.5 and 2707.75
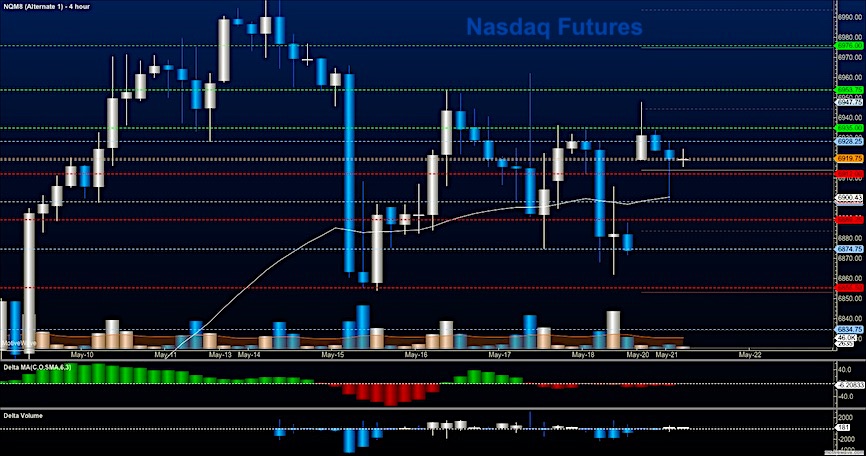
NASDAQ Futures
In line with Friday, this chart shows ranges holding while wicks stretch the edges. While price compression is apparent, there are quite a few opportunities on the edges of the formations in general. Below 6912, sellers will attempt to force us back into the lows and potentially fill the gap created by news events yesterday. The bullets below represent the likely shift of trading momentum at the successful or failed retests at the levels noted.
- Buying pressure intraday will likely strengthen with a bullish retest of 6934.75
- Selling pressure intraday will likely strengthen with a bearish retest of 6912.50
- Resistance sits near 6928.25 to 6946.5 with 6953.5 and 6976.25 above that.
- Support sits between 6916.75 and 6904.5, with 6889.75 and 6865.5 below that.
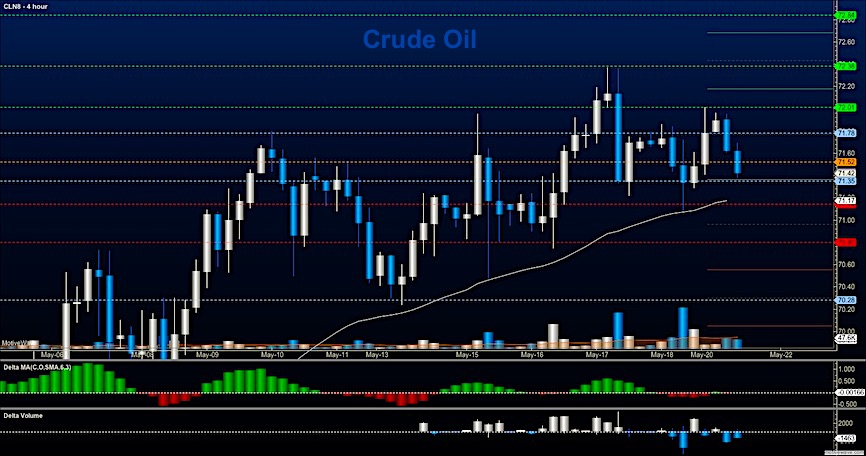
WTI Crude Oil
Sellers have kept the advance in price at bay this morning. These traders will become more aggressive with a failure to support 71.10. This chart is suggesting a bit of price compression as well with buyers nearby. Choose your trades wisely. Shorting to visible congestion is quite feasible here, but with the oil markets in a bullish expansion taking profit quickly is likely the better bet. Deeper pullbacks will be buying opportunities for now. The bullets below represent the likely shift of trading momentum at the successful or failed retests at the levels noted.
- Buying pressure intraday will likely strengthen with a bullish retest of 71.78
- Selling pressure intraday will strengthen with a bearish retest of 71.35
- Resistance sits near 72.01 to 72.38, with 72.77 and 73.34 above that
- Support holds near 71.17 to 70.83, with 70.45 and 69.56 below that
Twitter: @AnneMarieTrades
The author trades stock market futures every day and may have a position in mentioned securities at the time of publication. Any opinions expressed herein are solely those of the author, and do not in any way represent the views or opinions of any other person or entity.


