S&P 500 Index (INDEXSP:.INX) Market Outlook For Traders – September 9, 2016
S&P 500 Futures contracts have rolled into December expiration, resulting in a gap down due to mild backwardation. This is where the forward month is less than the current month. Key price support levels near 2167 are failing, but buyers have created bounce patterns in the charts for the last nine weeks. A shift in the pattern here might be a telling piece of information as to future motion on stock market futures. Market momentum is now bearish on shorter time frames, but we do sit at these key price support levels. If we are unable to recapture 2176, we could see further weakness develop.
See today’s economic calendar with a rundown of releases.
RANGE OF TODAY’S MOTION
S&P 500 Futures Trading Outlook For September 9th
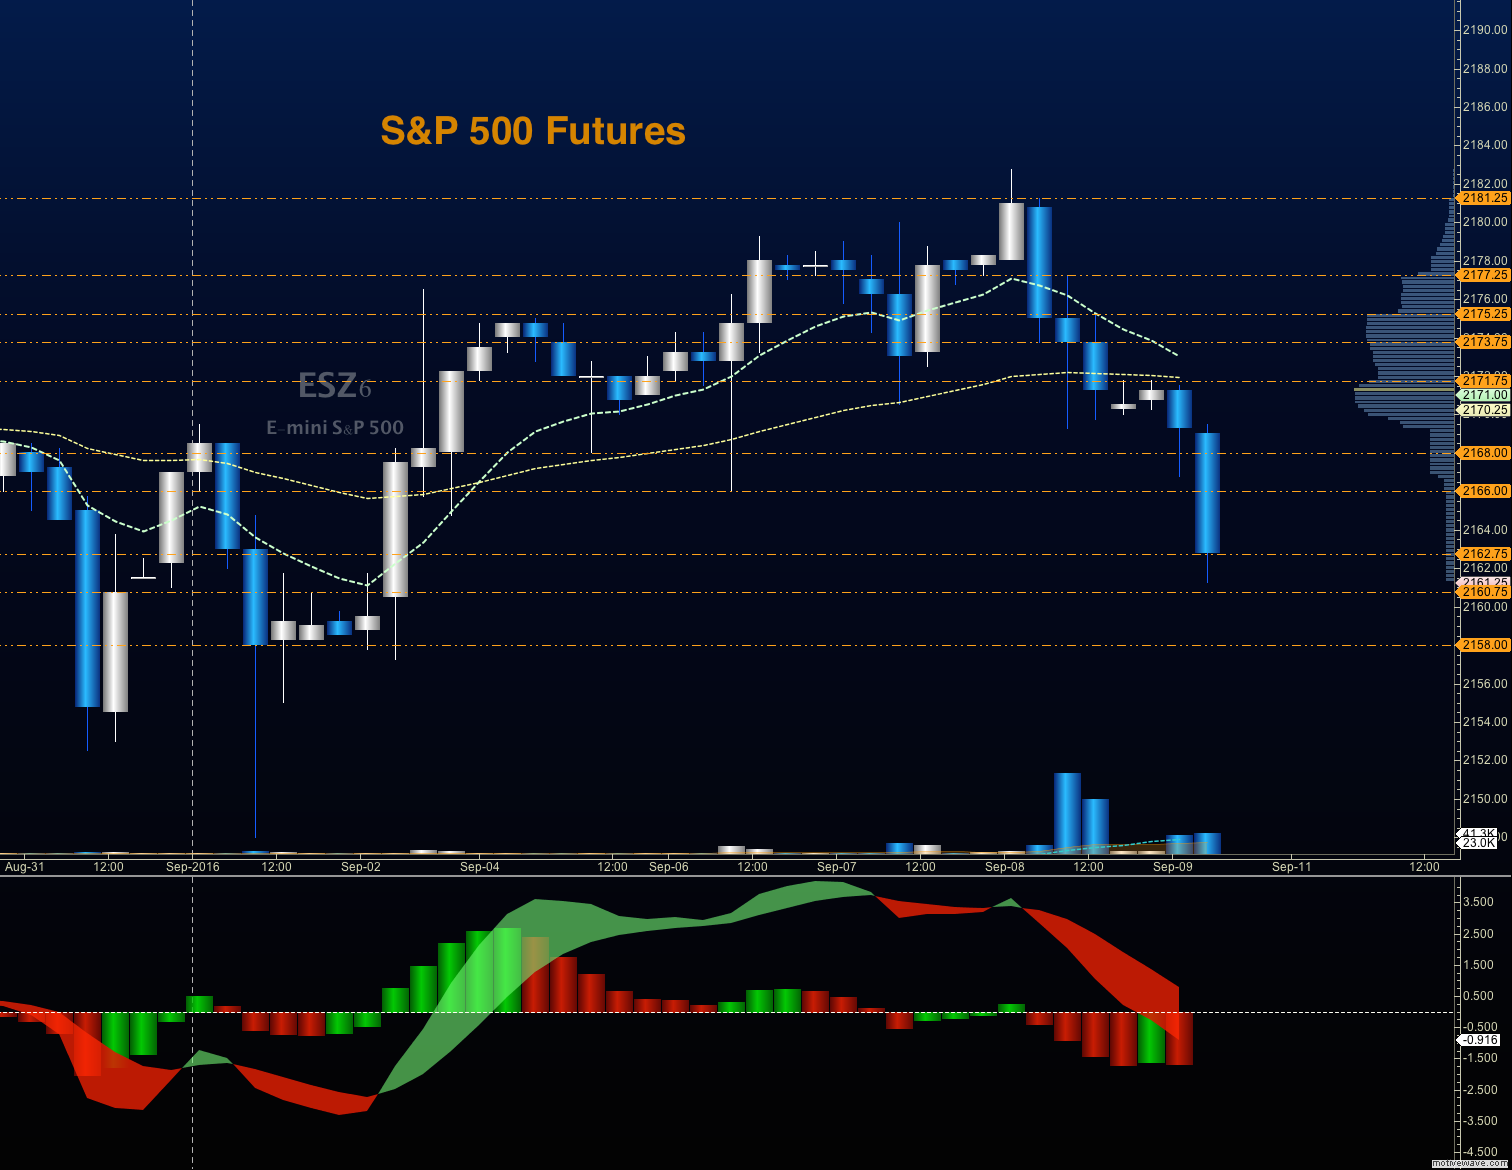
Upside trades on S&P 500 futures – Favorable setups sit on the positive retest of 2168.25, or a positive retest of the bounce off 2162.5 with upward momentum. I use the 30min to 1hr chart for the breach and retest mechanic. Targets from 2162.5 are 2166, 2169.25, 2171.5, 2173.75, 2175.75, 2179, 2181.5, and if we expand, we may stretch above into 2182.25, 2184.75, and 2187.75. A deeper support test near 2177 could also bring buyers back onto the playground – so use caution there.
Downside trades on S&P 500 futures – Favorable setups sit below the failed retest of 2164.5, or at the failed retest of 2167.5 with negative divergence. Retracement into lower levels from 2167.5 give us the targets 2164.5, 2162.25, 2160.5, 2157.75, 2154.75, and perhaps 2149.5, if the sellers collapse support.
If you’re interested in watching these trades go live, join us in the live trading room from 9am to 11:30am each trading day.
Nasdaq Futures
The NQ_F has faded, and is also struggling to hold support levels, as buyers appear lackluster this morning. Support sits near 4778, with 4765.5 below that. Resistance sits between 4801.25, and 4812.25.
Upside trades on Nasdaq futures – Favorable setups sit on the positive retest of 4789.5, or a positive retest of 4780 with positive momentum. I use the 30min to 1hr chart for the breach and retest mechanic. Targets from 4780 are 4782.25, 4784.5, 4787.5, 4792.25, 4794.5, 4797.75, and 4805.5 to 4812.25, if buyers continue to reverse the recent dip.
Downside trades on Nasdaq futures – Favorable setups sit below the failed retest of 4778, or at the failed retest of 4794.25 with negative divergence. Retracement into lower levels from 4794.25 gives us the targets 4792.5, 4789.75, 4787.5, 4784.5, 4781.5, 4778.5, 4774, 4771.25 and 4765.5 if sellers hold control.
Crude Oil
The EIA report released the biggest draw in history at 11am yesterday of over 14mm barrels, sending charts up over our targets and into new resistance near 47.75. Wide range bound behavior continues to be likely, as the chart has faded sharply since the peak made yesterday. Support sits near 46.46, with 46.05, below that. Resistance sits near 47.5, but could stretch into 47.86 if buyers resume control of motion.
Trading ranges for crude oil prices should hold between 46.4 and 47.86 today.
Upside trades on crude oil futures can be staged on the positive retest of 47.36, or at a positive retest off 46.46 with positive momentum. I often use the 30min to 1hr chart for the breach and retest mechanic. Targets from 46.46 are 46.82, 47.06, 47.18, 47.36, 47.49, 47.74, 47.86, and 48.08.
Downside trades on crude oil futures can be staged on the failed retest of 46.74 or at the failed retest of 47.24 with negative divergence. Targets from 47.24 are 47.08, 46.94, 46.82, 46.7, 46.52, 46.35, 46.04, 45.74, 45.57, 45.35, 45.04, and 44.74, if charts give way to selling.
If you’re interested in watching these trades go live, join us in the live trading room from 9am to 11:30am each trading day.
Visit TheTradingBook.com for more information.
If you’re interested in the live trading room, it is now primarily futures content, though we do track heavily traded stocks and their likely daily trajectories as well – we begin at 9am with a morning report and likely chart movements along with trade setups for the day.
As long as the trader keeps himself aware of support and resistance levels, risk can be very adequately managed to play in either direction as bottom picking remains a behavior pattern that is developing with value buyers and speculative traders.
Twitter: @AnneMarieTrades
The author trades stock market futures every day and may have a position in mentioned securities at the time of publication. Any opinions expressed herein are solely those of the author, and do not in any way represent the views or opinions of any other person or entity.


