Stock Market Trading Considerations For September 8, 2017
The S&P 500 (INDEXSP:.INX) and other broad market indices are hanging in there, trading in a tight range just below overhead resistance. Will stocks roll over or break above that resistance? Watch the trading levels (listed below).
Check out today’s economic calendar with a full rundown of releases. And note that the charts below are from our premium service and shared exclusively with See It Market readers.
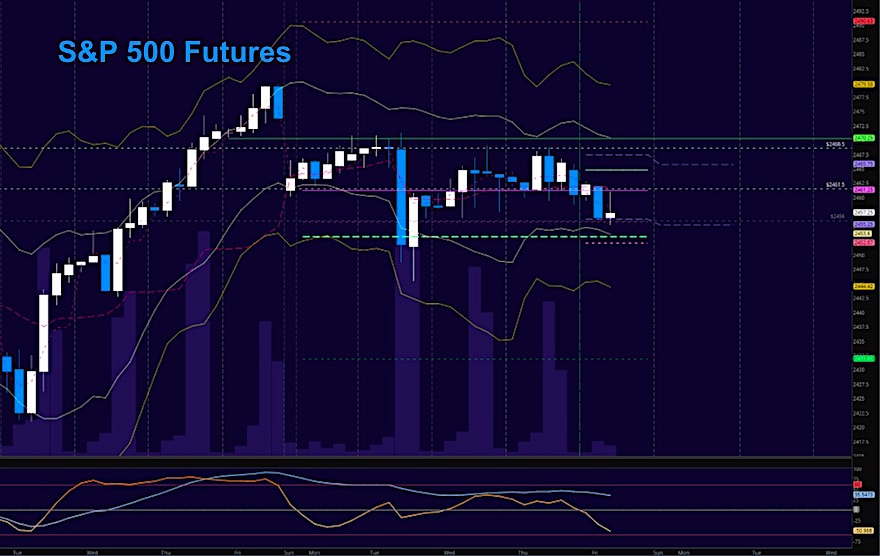
S&P 500 Futures (ES)
Congested behavior continues. Chart at the base of support with lower tests possible at 2451. Resistance holds steady at 2470.5. The bullets below represent the likely shift of trading momentum at the positive or failed retests at the levels noted.
- Buying pressure intradaywill likely strengthen above a positive retest of 2470.5
- Sellingpressure intraday will likely strengthen with a failed retest of 2454
- Resistance sits near 2469.75 to 2471.5, with 2474.5 and 2478.5 above that
- Support holds between 2451.5 and 2445.5, with 2439.5 and 2431.5 below that.
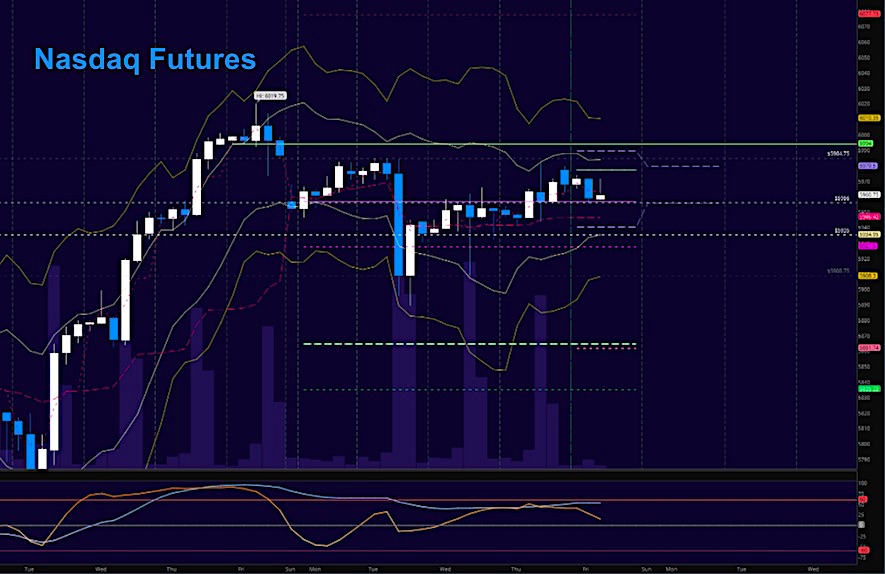
NASDAQ Futures (NQ)
Momentum continues mixed with lower highs still present. Range bound behavior between 5930.5 and 5980. The bullets below represent the likely shift of intraday trading momentum at the positive or failed tests at the levels noted.
- Buyingpressure intraday will likely strengthen with a positive retest of 5985
- Sellingpressure intraday will likely strengthen with a failed retest of 5930
- Resistance sits near 5977 to 5984.75, with 5994.25 and 6010.5 above that.
- Support holds between 5945.25 and 5917.5, with 5910 and 5891.5 below that.
WTI Crude Oil
Third day in a tighter range – so watch for the breaks below and above the range for signals of continuation. Resistance sits at 49.43 and 49.82. We sit above well above resistance at this time and momentum is mixed. Buyers will have the upper hand as long as we hold 48.4. The bullets below represent the likely shift of trading momentum at the positive or failed tests at the levels noted.
- Buyingpressure intraday will likely strengthen with a positive retest of 49.45
- Sellingpressure intraday will strengthen with a failed retest of 48.4
- Resistance sits near 49.39 to 49.63, with 49.71 and 49.99 above that.
- Support holds between 48.92 to 48.5, with 48.15 and 47.5 below that.

If you’re interested in watching these trades go live, join us in the live trading room from 9am to 11:30am each trading day. Visit TheTradingBook for more information.
If you’re interested in the live trading room, it is now primarily stock market futures content, though we do track heavily traded stocks and their likely daily trajectories as well – we begin at 9am with a morning report and likely chart movements along with trade setups for the day.
As long as the trader keeps himself aware of support and resistance levels, risk can be very adequately managed to play in either direction as bottom picking remains a behavior pattern that is developing with value buyers and speculative traders.
Twitter: @AnneMarieTrades
The author trades stock market futures every day and may have a position in mentioned securities at the time of publication. Any opinions expressed herein are solely those of the author, and do not in any way represent the views or opinions of any other person or entity.


