S&P 500 (INDEXSP:.INX) broad market overview and trading outlook for September 6, 2016 –
We begin our 8th week in the current trading range between 2164 and 2191 on the S&P 500 futures chart. And stock market momentum remains unchanged. Buyers are still saving the day at deeper price support levels, and sellers are still controlling the overhead supply to force charts back to congestion. After a U.S. holiday and light trading yesterday, S&P 500 futures (ES_F) are holding the top of higher support above 2174, but is failing to breach 2187.5. The latter price level stands as front line resistance. Market momentum suggests another range bound day, but pay attention to any breach of the future trading levels noted above. A failure to return to the region could signal a break- note that the “retest event” will be key to provide intraday direction.
See today’s economic calendar with a rundown of releases.
RANGE OF TODAY’S MOTION
S&P 500 Futures Trading Outlook For September 6th
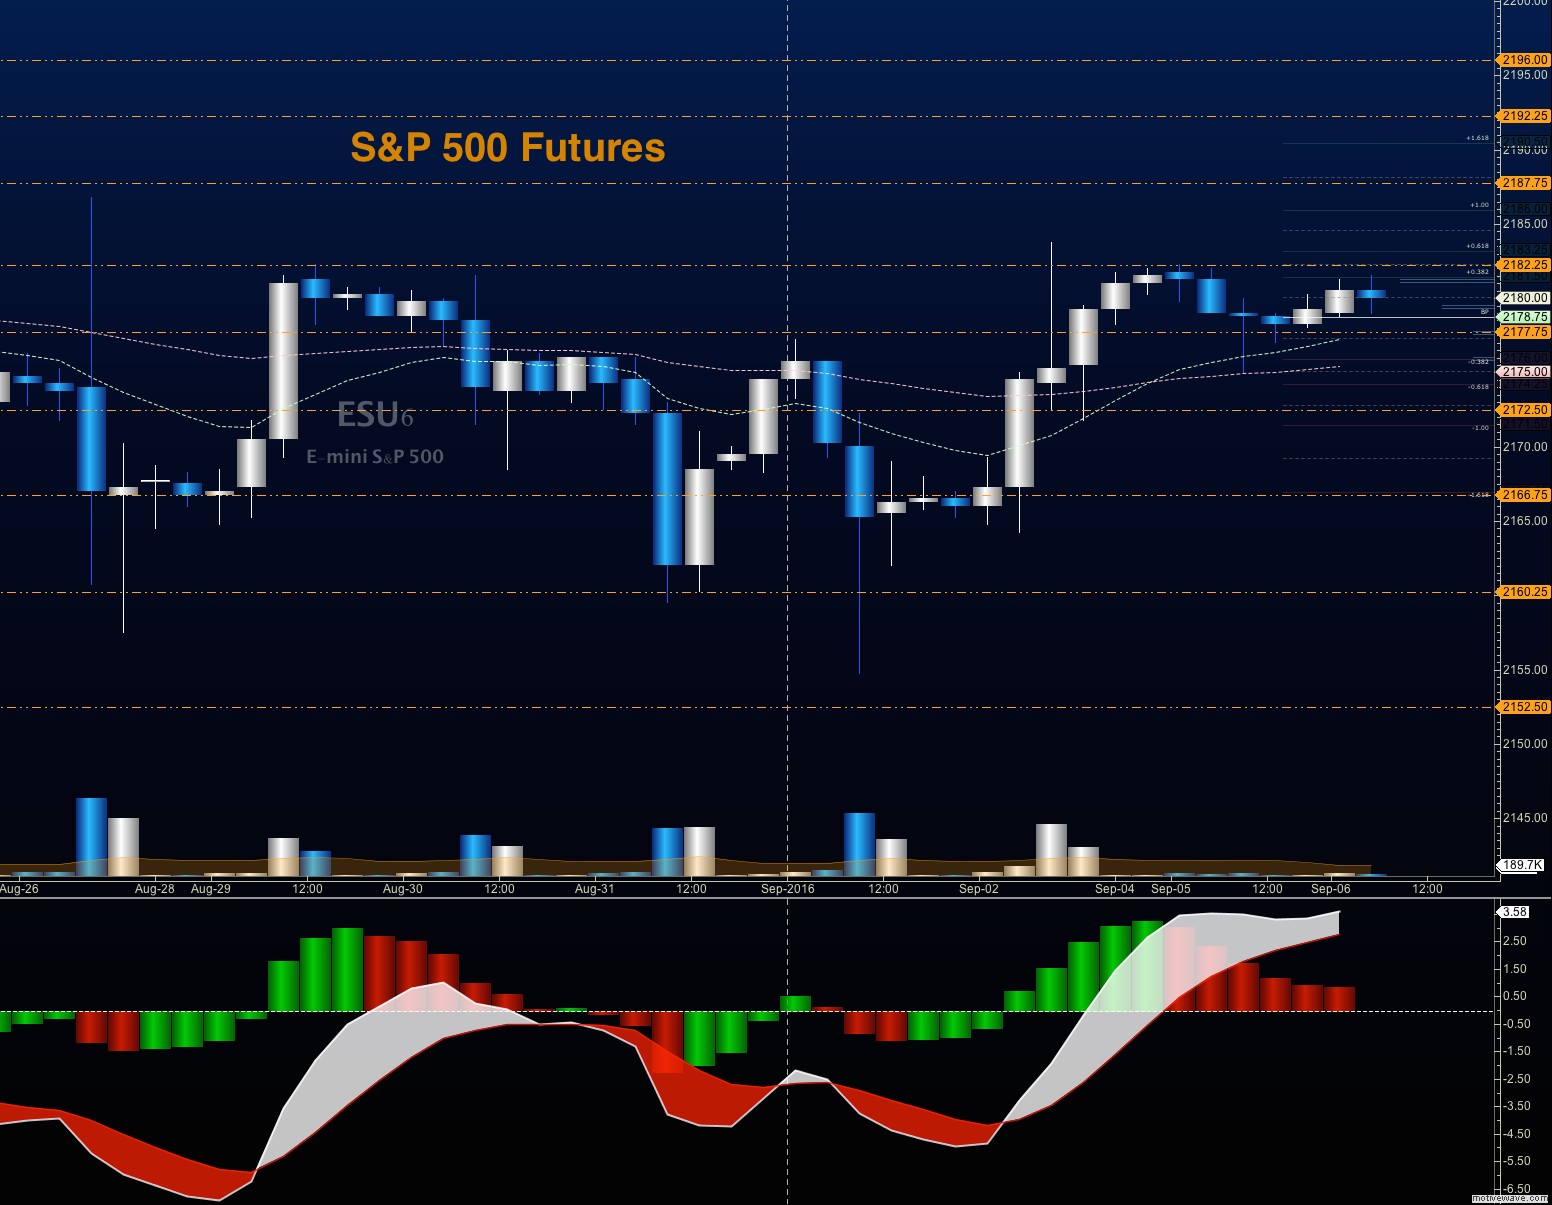
Upside trades on S&P 500 futures trading – Favorable setups sit on the positive retest of 2182.5, or a positive retest of the bounce off 2177.5 with upward momentum. I use the 30min to 1hr chart for the breach and retest mechanic. Targets from 2177.5 are 2182.25, 2184.75, 2187.75, 2189.25, and if we expand, we may stretch above into 2192 and 2194.75. A deeper support test near 2174 could also brings buyers back onto the playground – so use caution there.
Downside trades on S&P 500 futures trading- Favorable setups sit below the failed retest of 2176.75, or at the failed retest of 2182 with negative divergence. Retracement into lower levels from 2182 give us the targets 2178.75, 2177.75, 2175.5, 2172.5, 2170.5, 2168.75, 2165.25, 2160.5, 2158.25, 2154.75, and 2149.5, if sellers take over.
If you’re interested in watching these trades go live, join us in the live trading room from 9am to 11:30am each trading day.
Nasdaq Futures
The NQ_F sits at the top of the same congestion formation noted in the ES_F. The congested support levels now hold between 4792 and 4795.5. Breakdowns below there could stretch far lower into 4780.5. Resistance sits between 4803-4817.5, with expansions that could reach 4830, but that seems like the outside move here.
Upside trades on Nasdaq futures – Favorable setups sit on the positive retest of 4803.25, or a positive retest of 4795.75 with positive momentum. I use the 30min to 1hr chart for the breach and retest mechanic. Targets from 4795.75 are 4797.5, 4800.75, 4803, 4805.75, 4812.25, 4817.25, 4821.5, 4824.25, and 4829.75, if buyers continue to reverse the recent dip.
Downside trades on Nasdaq futures – Favorable setups sit below the failed retest of 4795, or at the failed retest of 4805.5 with negative divergence. Retracement into lower levels from 4805.5 gives us the targets 4801.25, 4798.5, 4795.75, 4792.25, 4790.75, 4787.5, 4782, 4780.5, 4777.75, 4774, 4771.75, 4769.5, 4764.5, 4761.5, and 4757.5 to 4751.5, if sellers resume control.
Crude Oil
The WTI Crude charts have been sideways after a volatile week, moving between 44.7 and 45.47. Big wicks continue to shake traders out on expansions, to return to the congested range. Support sits just below congestion at 44.55, with targets below at 44.08. Resistance sits near 45.76 but could stretch into 46.11 above that.
Trading ranges for crude oil prices should hold between 44.08 and 46.11 today.
Upside trades on crude oil can be staged on the positive retest of 45.27, or at a positive retest off 44.74 with positive momentum. I often use the 30min to 1hr chart for the breach and retest mechanic. Targets from 44.74 are 45.05, 45.21, 45.47, 45.76, 45.97, and 46.11, if buyers really power forward.
Downside trades on crude oil can be staged on the failed retest of 44.74 or at the failed retest of 45.76 with negative divergence. Targets from 45.76 are 45.47, 45.27, 45.05, 44.74, 44.55, 44.22, 44.08, 43.81, 43.59, 43.38, 43.24, 43.11, 42.9, and 42.62.
If you’re interested in watching these trades go live, join us in the live trading room from 9am to 11:30am each trading day.
Visit TheTradingBook.com for more information.
If you’re interested in the live trading room, it is now primarily stock market futures content, though we do track heavily traded stocks and their likely daily trajectories as well – we begin at 9am with a morning report and likely chart movements along with trade setups for the day.
As long as the trader keeps himself aware of support and resistance levels, risk can be very adequately managed to play in either direction as bottom picking remains a behavior pattern that is developing with value buyers and speculative traders.
Twitter: @AnneMarieTrades
The author trades stock market futures every day and may have a position in mentioned securities at the time of publication. Any opinions expressed herein are solely those of the author, and do not in any way represent the views or opinions of any other person or entity.


