Broad Stock Market Futures Outlook for April 17, 2018
Higher lows prevailed to give us higher highs as buyers push us into regions not seen since mid-March in solid earnings releases. Resistance watches are still the order of the day as momentum holds bullish.
How well we bounce off pullbacks will be the thing to watch for weakness – along with lower highs that may present. Pullbacks will continue to be buying zones in the present formation with tests higher to be likely as well.
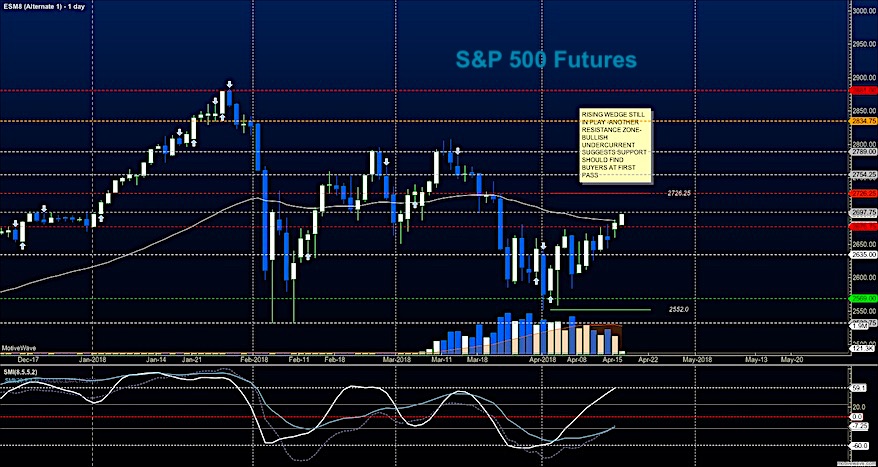
S&P 500 Futures
Earnings fuel the press upward and traders are likely to take us to resistance near 2726. Pullbacks at the first pass into congestion will still provide good buying regions for traders. The bullets below represent the likely shift of trading momentum at the positive or failed retests at the levels noted.
- Buying pressure intraday will likely strengthen with a bullish retest of 2698.75
- Selling pressure intraday will likely strengthen with a bearish retest of 2691.50
- Resistance sits near 2697.75 to 2709.75, with 2726.25 and 2734.75 above that.
- Support sits between 2692.75 and 2678.50, with 2668.75 and 2654.50
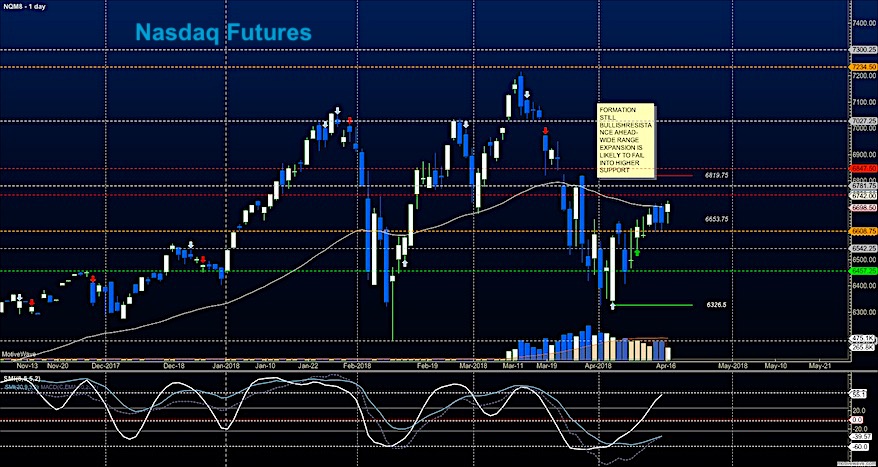
NASDAQ Futures
Solid earnings releases in the sector push prices forward – near a new resistance level of 6762. Pullbacks into congestion and support will still be buying zones. Holding 6697 will be important to buyers today. Resistance should fade into higher lows but watch for the failure to breach higher in the motion today for clues of reversal. The bullets below represent the likely shift of intraday trading momentum at the positive or failed tests at the levels noted.
- Buying pressure intraday will likely strengthen with a bullish retest of 6698.75
- Selling pressure intraday will likely strengthen with a bearish retest of 6648
- Resistance sits near 6762.5 to 6795.5 with 6821.5 and 6849.25 above that.
- Support sits between 6746.5 and 6725.5, with 6697.75 and 6638.75 below that.
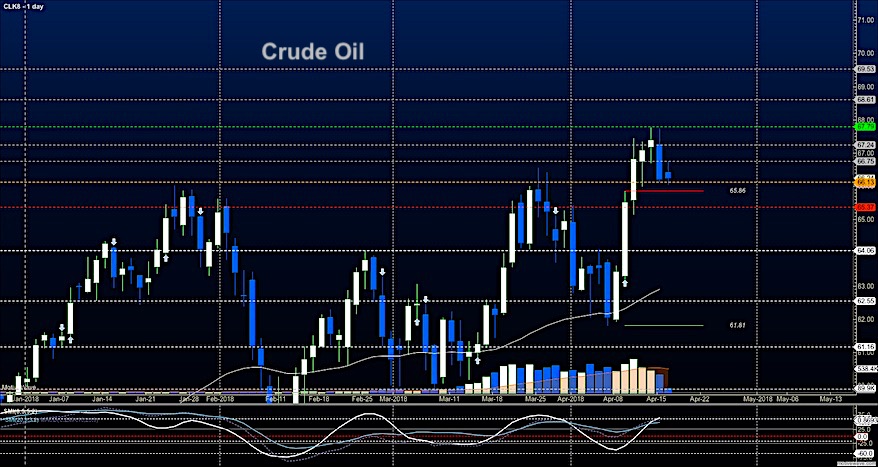
WTI Crude Oil
Higher lows hold into the API report after the close and the EIA report tomorrow. The traders have been arguing around 66.1 for several hours so this is the line in the sand for motion. Deep fades will still be buying zones but allow the chart to settle at known congestion/support before assessing risk and entering the trades. The failure to make new highs is the first test of a reversing formation – and we still have this. The bullets below represent the likely shift of intraday trading momentum at the positive or failed tests at the levels noted.
- Buying pressure intraday will likely strengthen with a bullish retest of 66.74
- Selling pressure intraday will strengthen with a bearish retest of 66.06
- Resistance sits near 66.72 to 67.24, with 67.75 and 68.7 above that.
- Support holds near 66.1 to 65.72, with 65.56 and 65.2 below that.
Twitter: @AnneMarieTrades
The author trades stock market futures every day and may have a position in mentioned securities at the time of publication. Any opinions expressed herein are solely those of the author, and do not in any way represent the views or opinions of any other person or entity.


