Stock Market Outlook for October 13, 2016 – Charts lose front line support and are struggling to recapture prior levels.
S&P 500 futures have continued downward – my supposition is that traders are further minimizing exposure into the uncertainty of FOMC rate increases and/or election outcome. The sell off on the S&P 500 (INDEXSP:.INX) is orderly, and not frenetic. The volume, though more than the day before, did not signal a breakdown to me. The failed retest of 2130 overnight brought us to the first test of 2115 on S&P 500 futures. The market needs to recapture 2122, or else we’ll see deeper moves into the 2111-2109 area. Price resistance is lodged at 2128-2132; a breach there will bring buyers back into the fold and could push the market up into the 2137-2144 zone.
See today’s economic calendar with a rundown of releases.
TODAY’S RANGE OF MOTION
S&P 500 Futures Trading Chart – October 13
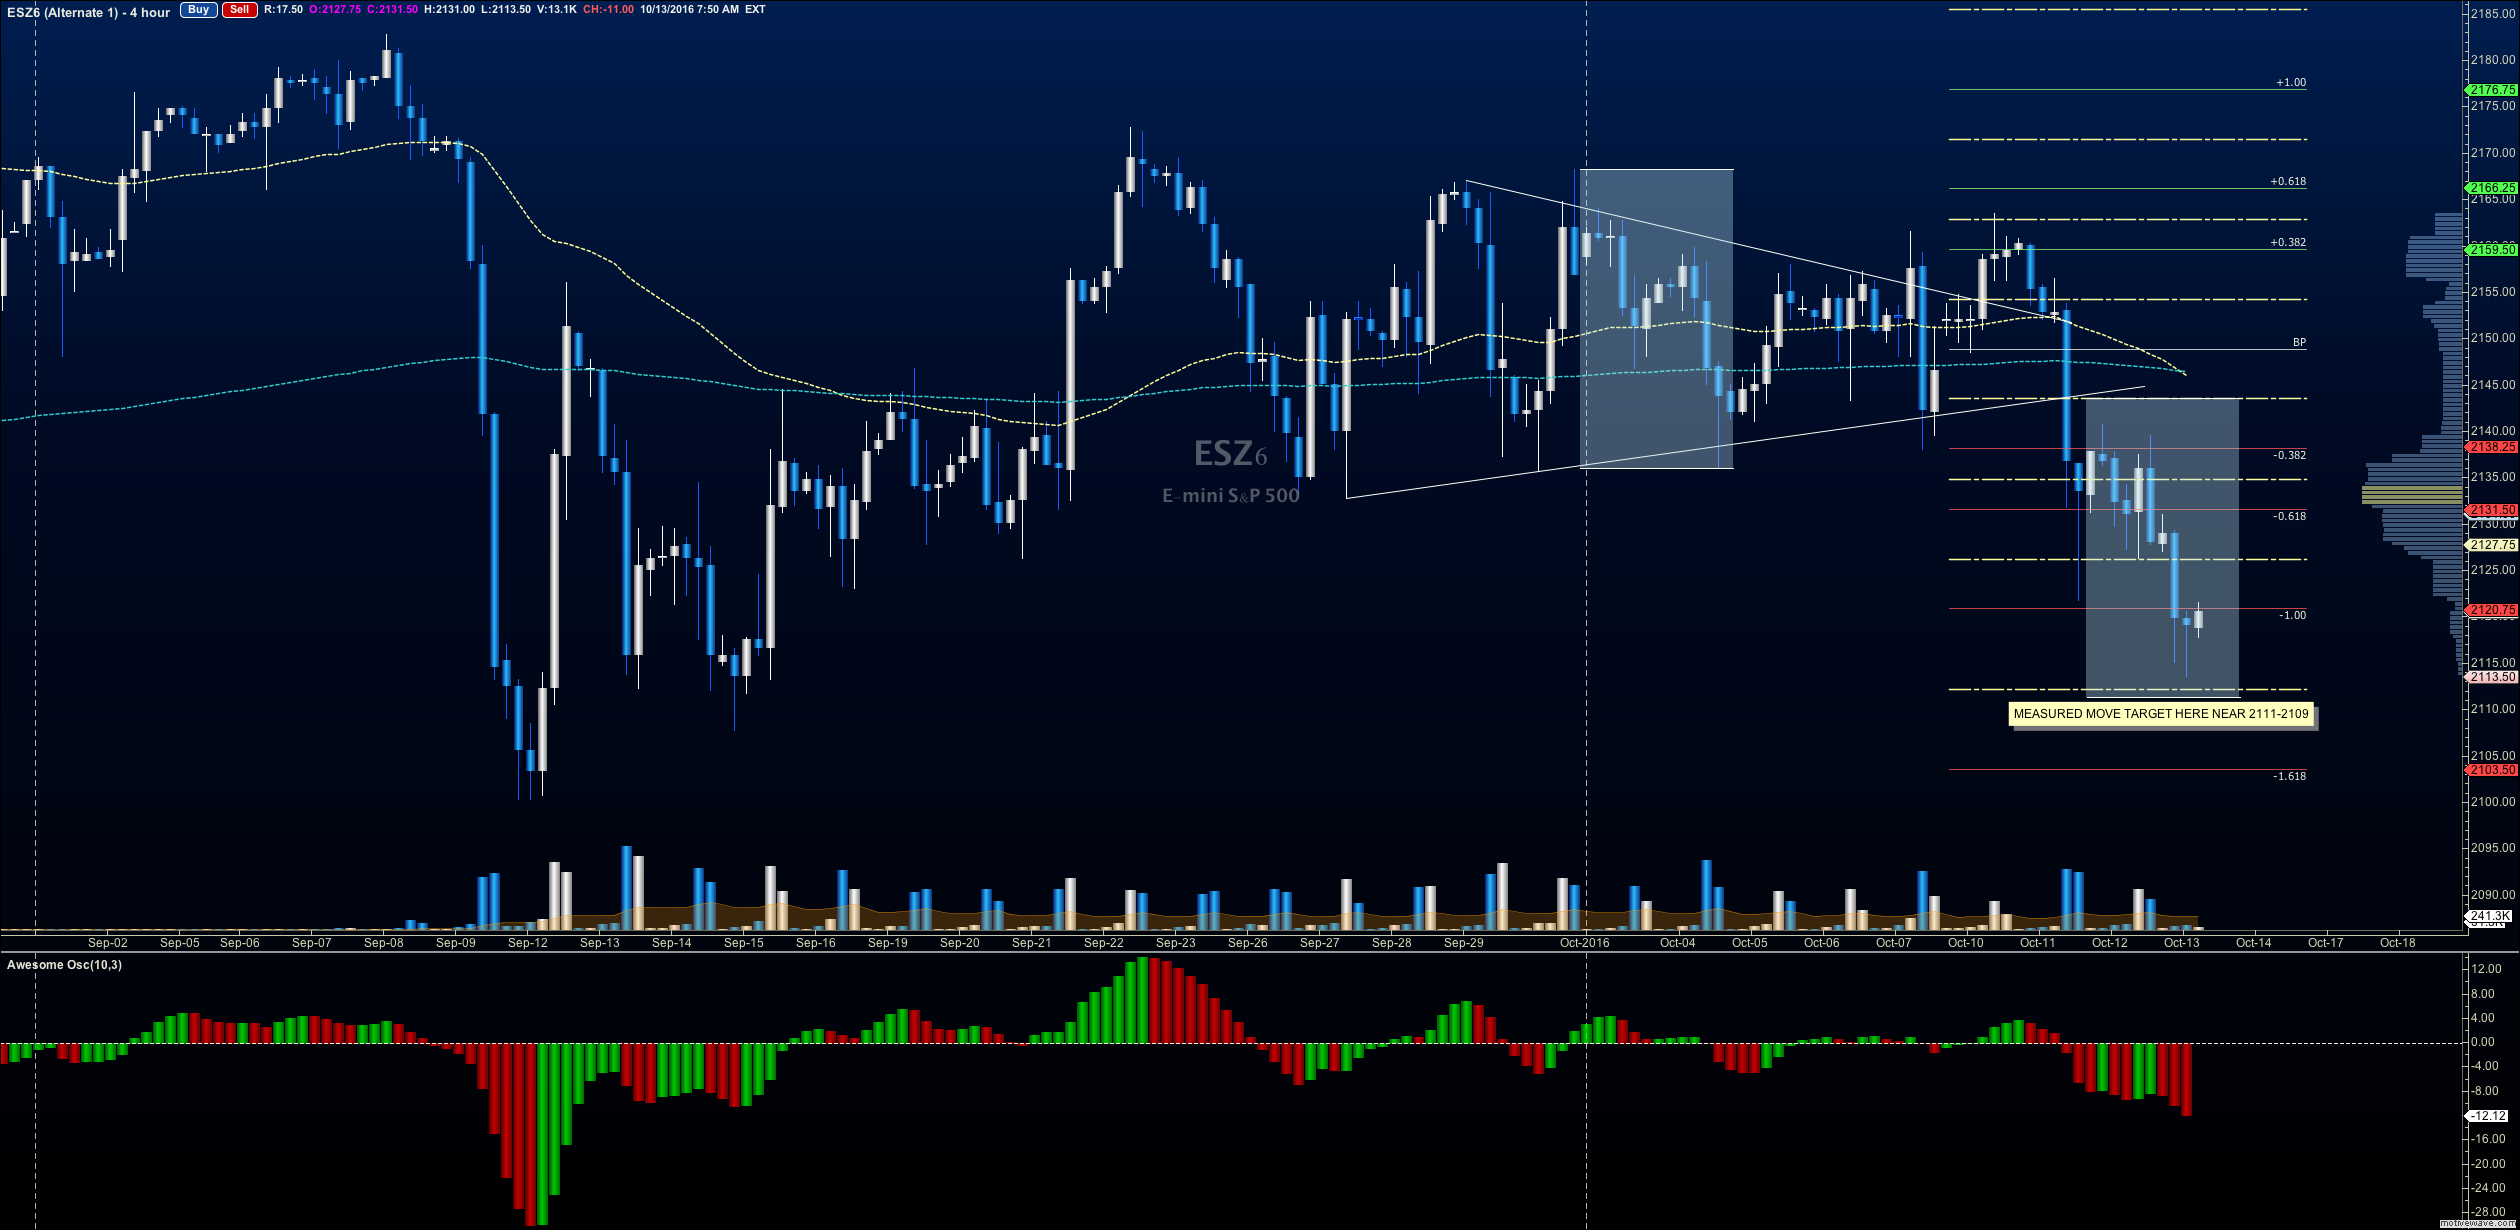
Upside trades on S&P 500 futures – Favorable setups sit on the positive retest of 2122, or a positive retest of the bounce off 2111.5 with upward momentum. For now, bounces into resistance are all that seem apparent. I use the 30min to 1hr chart for the breach and retest mechanic. Targets from 2111.5 are 2115, 2118.75, 2121.75, 2126.25, 2129, 2132, 2136, 2138, 2140.50, 2144, and 2146.5. As always, additional targets will be in the Members only portion of the morning blog.
Downside trades on S&P 500 futures – Favorable setups sit below the failed retest of 2125.25, or at the failed retest of 2134.5 with negative divergence. Only the failed retest of 2110 with negative divergence gives us a continued short. Retracements into lower levels from 2134.5 give us the targets 2132, 2129.75, 2124.75, 2121.75, 2115.5, 2111.25, 2107.75, and 2103.25.
Nasdaq Futures
The Nasdaq futures (NQ_F) chart tested our very familiar support level of 4774 before holding footing, but having a dreadful time recapturing old support of 4789. Failure to recapture this area leaves the chart very prone to selloff. I suspect we are close to a bounce, but that bounce is likely to fail as we come into 4802-4804.
Upside trades on Nasdaq futures – Favorable setups sit on the positive retest of 4805.25, or a positive retest of 4789.75 with positive momentum. Bounces are likely to be into resistance for now. I use the 30min to 1hr chart for the breach and retest mechanic. Targets from 4789.75 are 4795.75, 4800.75, 4804.75, 4808.25, 4811.25, 4816, 4821.5, 4824, 4834.75, 4840.5, and 4842.
Downside trades on Nasdaq futures – Favorable setups sit below the failed retest of 4788 (needs negative momentum here for continuation), or at the failed retest of 4809.25 with negative divergence. Retracements into lower levels from 4809.25 are 4804.5, 4800.75, 4797.75, 4795.5, 4790.25, 4784.5, 4780.25, and 4774. I suspect we hold the low for the morning, but if the chart gives us a failure at 4800, we could breach the 4774 level.
Crude Oil
After five weeks of draws on inventory, the API reported a build yesterday. This brought the chart into the support level noted near 49.6. The EIA report is out today at 10:30am. Sellers are sitting near 50.65, and near 51.17. Support is lower today, and sits at 49.6 to 49.4
Trading ranges on crude oil should hold between 49.04 and 51.49 in the current pattern.
Upside trades on crude oil futures can be staged on the positive retest of 50.35, or at a positive retest off 50.07 with positive momentum. I often use the 30min to 1hr chart for the breach and retest mechanic. Targets from 50.07 are 50.35, 50.6, 50.85, 51.02, 51.16, 51.36, and 51.49.
Downside trades on crude oil futures can be staged on the failed retest of 49.8, or at the failed retest of 50.6 with negative divergence. Targets from 50.6 are 50.38, 50.24, 50.08, 49.84, 49.68, 49.57, 49.41, 49.24, and 49.14.
If you’re interested in the live trading room, it is now primarily stock market futures content, though we do track heavily traded stocks and their likely daily trajectories as well – we begin at 9am with a morning report and likely chart movements along with trade setups for the day.
As long as the trader keeps himself aware of support and resistance levels, risk can be very adequately managed to play in either direction as bottom picking remains a behavior pattern that is developing with value buyers and speculative traders.
Twitter: @AnneMarieTrades
The author trades stock market futures every day and may have a position in mentioned securities at the time of publication. Any opinions expressed herein are solely those of the author, and do not in any way represent the views or opinions of any other person or entity.


 Ready To Break Out?")