Stock Market Outlook October 12, 2016 – Charts hold support, but wedge pattern breaks down
In a surprising break of support early in the day, the S&P 500 (INDEXSP:.INX) moved in an orderly fashion downward. The volume, though more than the day before, did not signal a breakdown to me. As of this morning, S&P 500 futures are sitting at the lower edge of range support. As well, price has come into the weekly target zone (lower) that I had estimated. That edge sits at 2121 -2122 on S&P 500 futures and represents a strong value area and it was quickly bought up. Sellers have the upper hand for now, but buyers have come into the space many times over to save the day. A failed retest of 2130 today will likely signal a deeper move into 2115 to 2109 – but that seems a bit unlikely as of this writing. Price resistance is lodged at 2135-2141; a breach there will bring buyers back in force up into 2147-2151.
See today’s economic calendar with a rundown of releases.
TODAY’S RANGE OF MOTION
S&P 500 Futures Trading Chart – Stock Market Outlook October 12
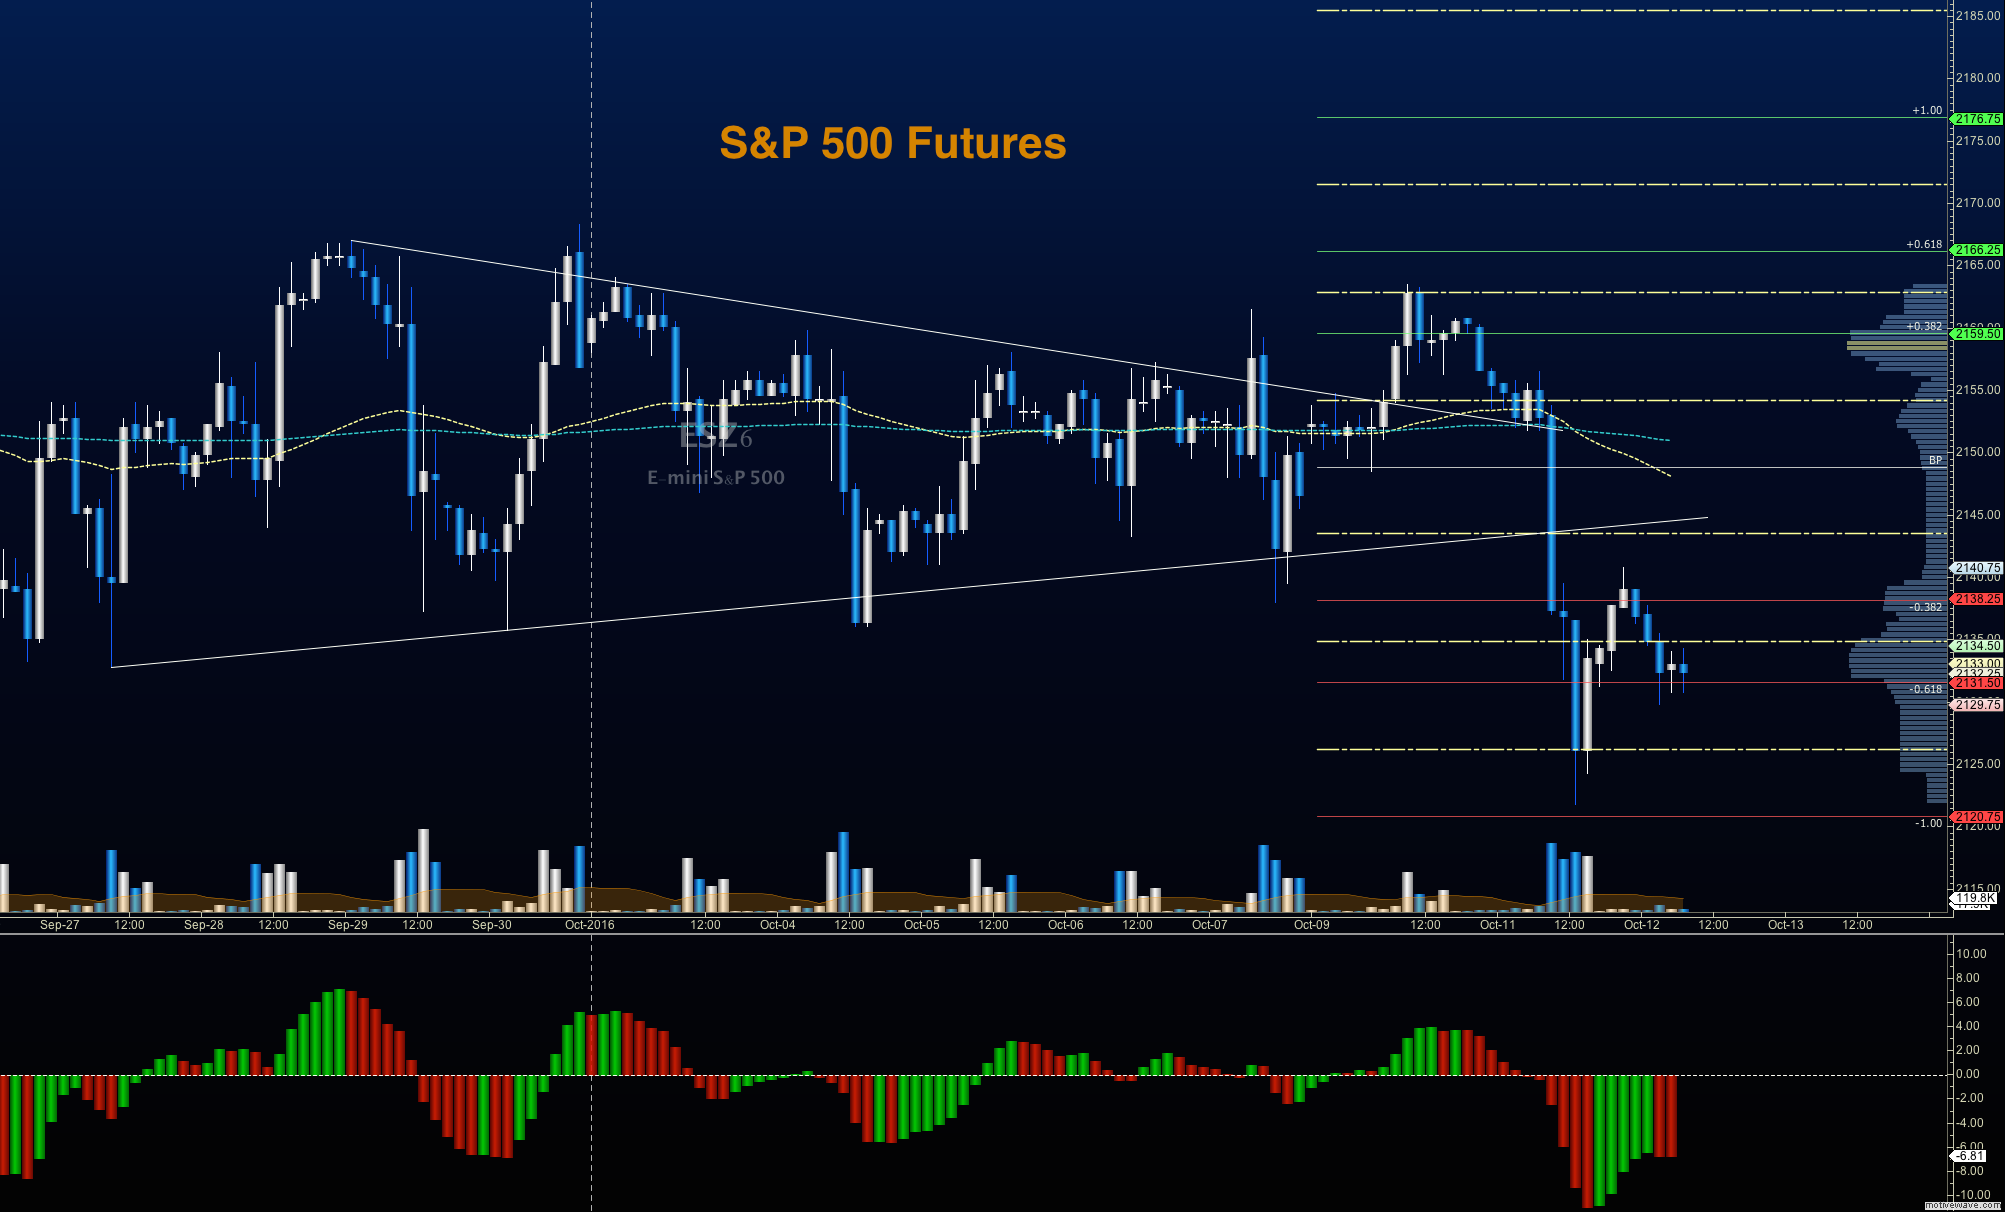
Upside trades on S&P 500 futures – Favorable setups sit on the positive retest of 2136, or a positive retest of the bounce off 2134.5 with upward momentum. Charts are congested in these price ranges, so trading is likely to be choppy until the breach above 2164. I use the 30min to 1hr chart for the breach and retest mechanic. Targets from 2134.5 are 2136, 2138, 2140.50, 2144, 2146.25, 2150.5, 2155.5, 2157.5, and 2160.25. As always, additional targets will be in the Members only portion of the morning blog.
Downside trades on S&P 500 futures – Favorable setups sit below the failed retest of 2132.25, or at the failed retest of 2139.5 with negative divergence. Retracements into lower levels from 2139.5 give us the targets 2136.25, 2134.25, 2132.5, 2129.75, 2124.75, 2121.75 and 2115.5.
Nasdaq Futures
The chart of Nasdaq futures broke its rising wedge, and faded to deep support near 4797. There is a support below near 4788.5 below. As the chart struggles to hold 4824, it will be the line in the sand between the buyers and sellers. Resistance sits near 4842 – with 4850.5 above that.
Upside trades on Nasdaq futures – Favorable setups sit on the positive retest of 4825.75, or a positive retest of 4818.5 with positive momentum. I use the 30min to 1hr chart for the breach and retest mechanic. Targets from 4818.5 are 4821.5, 4824, 4834.75, 4840.5, 4842, 4845.25, 4850.25, 4854, 4857.5, and 4862.
Downside trades on Nasdaq futures – Favorable setups sit below the failed retest of 4814.5, or at the failed retest of 4834 with negative divergence. Retracements into lower levels from 4834 are 4830.75, 4826.5, 4822.25, 4818.5, 4814.5, 4811.25, 4807.5, 4802.75, and 4797.75.
Crude Oil
Oil faded into support, and bounced into lower highs. The API report is out today after the close. Sellers are sitting near 51.46, and near 51.17. Buyers should hold the pullbacks to support as most of the news stays bullish for now – new support sits at 50.63 to 50.4, but trades have been choppy at the edges of the formation.
Trading ranges for crude oil should hold between 50.21 and 51.89 in the current pattern.
Upside trades on crude oil futures can be staged on the positive retest of 51.17, or at a positive retest off 50.64 with positive momentum. I often use the 30min to 1hr chart for the breach and retest mechanic. Targets from 50.64 are 50.8, 51.02, 51.16, 51.36, 51.48, 51.64, and 51.87.
Downside trades on crude oil futures can be staged on the failed retest of 50.6, or at the failed retest of 51.05 with negative divergence. Targets from 51.05 are 50.91, 50.76, 50.62, 50.38, 50.24, 50.11, 49.84, 49.68, 49.57, 49.43, and 49.14.
If you’re interested in the live trading room, it is now primarily stock market futures content, though we do track heavily traded stocks and their likely daily trajectories as well – we begin at 9am with a morning report and likely chart movements along with trade setups for the day.
As long as the trader keeps himself aware of support and resistance levels, risk can be very adequately managed to play in either direction as bottom picking remains a behavior pattern that is developing with value buyers and speculative traders.
Twitter: @AnneMarieTrades
The author trades stock market futures every day and may have a position in mentioned securities at the time of publication. Any opinions expressed herein are solely those of the author, and do not in any way represent the views or opinions of any other person or entity.


 Ready To Break Out?")


