Stock Market Outlook for November 30, 2016 –
Stock market futures charts look poised to expand as S&P 500 futures held price support near 2198 for a couple of days. S&P 500 futures are now holding just above price resistance as news sits slightly bullish all around. Pullbacks on the S&P 500 (INDEXSP:.INX) should find buyers today as we hold the form of higher lows and higher highs. End of the month trading will make for difficult patterns and erratic price action for stocks, though. The line in the sand for buying support intraday will be 2206-2203. Price resistance sits between 2211.5-2214.75. Momentum is bullish in form, but still under pressure.
See today’s economic calendar with a rundown of releases.
TODAY’S RANGE OF MOTION
S&P 500 Futures Trading Chart – November 30
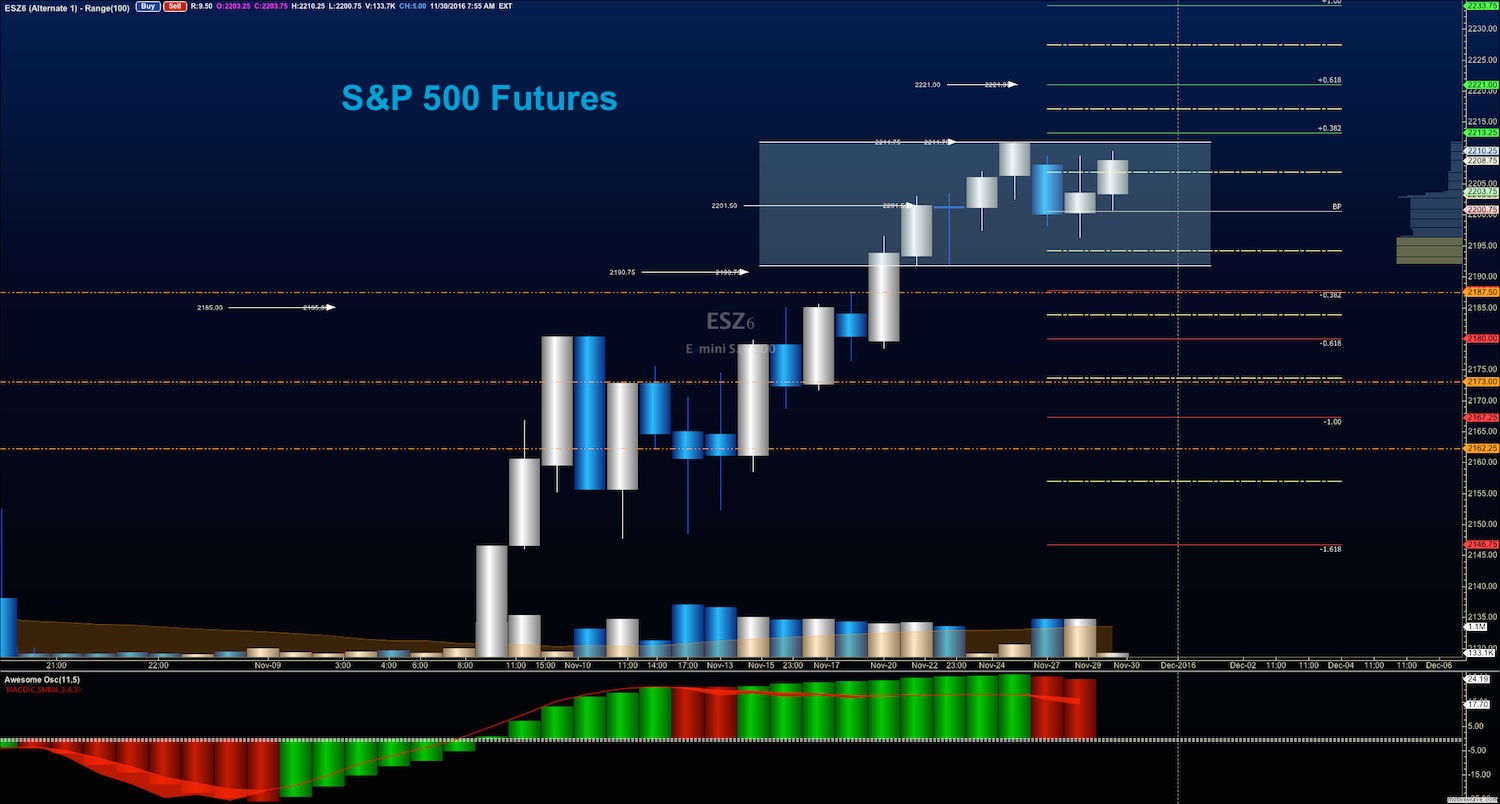
Upside trades for S&P 500 futures – Two options for entry
Positive retest of continuation level – 2209.50
Positive retest of support level – 2203.50
Opening targets ranges – 2206.50, 2209.5, 2211.75, and 2215.50
Downside trades – Two options for entry
Failed retest of resistance level – 2214.25
Failed retest of support level – 2206.25
Opening target ranges – 2211.75, 2209.25, 2205.75, 2201.75, 2198.50, and 2197.50
Nasdaq Futures
The NQ_F attempted a breach of its channel but faded back into higher congested support. Support levels to watch today are higher than yesterday and will be near 4864-4867. Resistance is higher and now within the region from 4884.5 to 4905. End of the month volume and traders jockeying in portfolios will make for tough trading. The trend is upside and pullbacks are likely to be bought.
Upside trades for Nasdaq futures – Two options
Positive retest of continuation level – 4886.5
Positive retest of support level – 4867.5
Opening target ranges – 4870.5, 4874.75, 4878.75, 4880, 4884.50, 4890.50, 4896.50, and 4899 to 4905 if we expand again
Downside trades for Nasdaq futures – Two options
Failed retest of resistance level – 4882.50
Failed retest of support level – 4867.75
Opening target ranges – 4878.75, 4874.50, 4872.25, 4868.75, 4864.50, 4860.25, and 4857.50 to 4854.75
Crude Oil – WTI
OPEC deal chatter continues to rule price action with a monster spike in the early morning with news out of Vienna. Iran has said they will be part of a deal but that deal will not involve curtailing production in the near term. All that news, however, is nothing but chatter. The spike is like a combination of excited buyers and stop being run, so we should see a retrace. Resistance rests between 49.3 and 49.79. The EIA report also is ahead.
Upside trades for Crude Oil – Two options
Positive retest of continuation level – 48.86
Positive retest of support level – 48.46
Opening target ranges – 48.74, 48.86, 48.94, 49.14, 49.49, and 49.78
Downside trades for Crude Oil – Two options
Failed retest of resistance level – 47.80
Failed retest of support level – 48.64
Opening target ranges – 47.55, 47.28, 47.11, 46.77, 46.57, and 46.41 to 46.18
If you’re interested in the live trading room, it is now primarily stock market futures content, though we do track heavily traded stocks and their likely daily trajectories as well – we begin at 9am with a morning report and likely chart movements along with trade setups for the day.
As long as the trader keeps himself aware of support and resistance levels, risk can be very adequately managed to play in either direction as bottom picking remains a behavior pattern that is developing with value buyers and speculative traders.
Twitter: @AnneMarieTrades
The author trades stock market futures every day and may have a position in mentioned securities at the time of publication. Any opinions expressed herein are solely those of the author, and do not in any way represent the views or opinions of any other person or entity.


: Showing Some Signs of Emerging Strength")
