Stock Market Outlook for November 2, 2016 –
The weekly low price target for S&P 500 futures was achieved yesterday. And today, the S&P 500 Index (INDEXSP:.INX) is attempting to bounce off these levels. But buying pressure is weak across the board, so it should be a battle. The bounce action needs to penetrate 2125 if buyers have a shot at a bigger move higher. The FOMC is set to release information but an interest rate hike is virtually improbable this close to an election. December’s FOMC release may have that interest rate hike that is expected. The key area of price resistance to recapture is near 2112.25. Bounces are quite likely to be sold in this formation. Tight congestion patterns still hold overhead between 2123 and 2137. Price support holds near 2094-2088
See today’s economic calendar with a rundown of releases.
TODAY’S RANGE OF MOTION
S&P 500 Futures Trading Chart – November 2
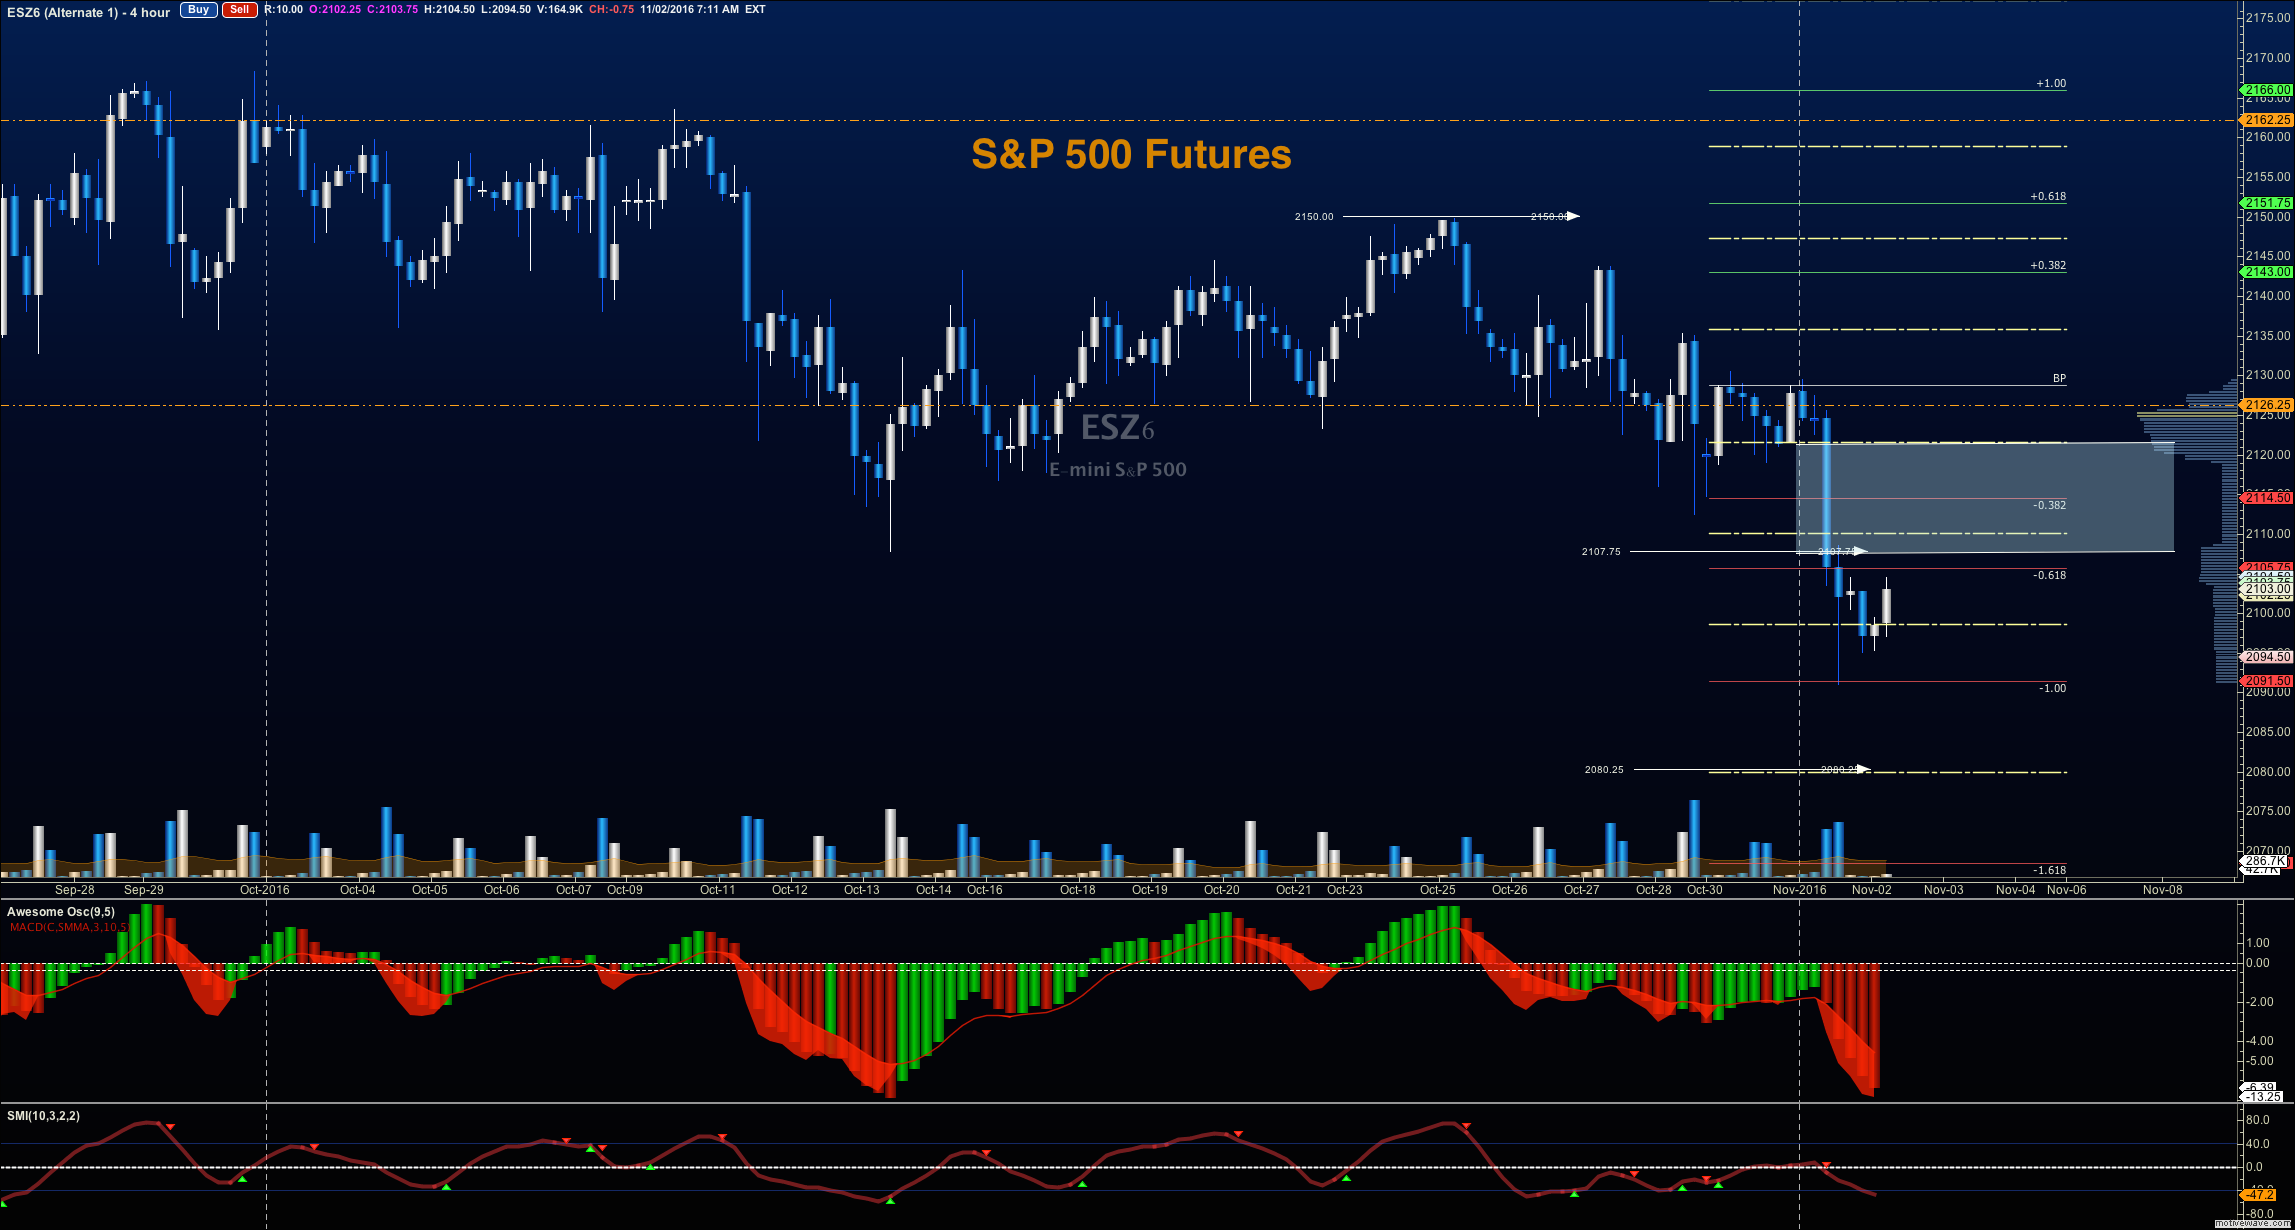
Upside trades on S&P 500 futures – Favorable setups sit on the positive retest of 2104.5, or a positive retest of the bounce off 2094.5 with upward momentum. I use the 30min to 1hr chart for the breach and retest mechanic. Targets from 2094.50 are 2101.5, 2104.5, 2107.75, 2110.25, 2112.25, 2119.5, 2126.5, 2130.75, 2136.5, and 2140.5.
Downside trades on S&P 500 futures – Favorable setups sit below the failed retest of 2104, or at the failed retest of 2094 (watch for the higher low if this is attempted) with negative divergence. Retracements into lower levels from 2104 give us the targets of 2100.25, 2094.75, 2091.5, 2088.5, and perhaps 2075.75, if charts cascade again.
Nasdaq Futures
The NQ_F faded deeply once more and is presenting another lower high, but holding its lows from yesterday. The level to breach above in the $NQ_F will be 4774 and as long as we stay below that level, we remain prone to selling pressure. Support sits in the region between 4718 and 4704.
Upside trades on Nasdaq futures – Favorable setups sit on the positive retest of 4756.75, or a positive retest of 4740.5 with positive momentum. I use the 30min to 1hr chart for the breach and retest mechanic. Targets from 4740.5 are 4753.25, 4756, 4762.25, 4770, 4774.5, 4782, 4790.75, 4802.75, 4814, and 4817.5.
Downside trades on Nasdaq futures – Favorable setups sit below the failed retest of 4737 (needs negative momentum here for continuation), or at the failed retest of 4760 with negative divergence. Retracements into lower levels from 4760 are 4756.5, 4750.5, 4743.75, 4737.5, 4728.75, 4720.5, 4704, and 4686.5 should selling continue.
Crude Oil
API reported quite large builds in barrel count yesterday, and that sent the chart falling once more into a key support level near 45.89. The EIA report is at 10:30 eastern time today. We’ve done little to try to hold key support levels and there are several auction vacuums in the price action profile. This could mean very choppy trading ahead. The chart still holds negative momentum for now.
Trading ranges for crude oil futures on the week have expanded on the lower end – 44.54 to 48.4 in the current pattern.
Upside trades on crude oil futures can be staged on the positive retest of 46.12, or at a positive retest off 45.84 with positive momentum. I often use the 30min to 1hr chart for the breach and retest mechanic. Targets from 46.12 are 46.29, 46.55, 46.8, 47.24, 47.54, and 47.72. See the blog for more details on the chart action, and for additional targets if the chart breaks through the upper level.
Downside trades on crude oil futures can be staged on the failed retest of 45.8, or at the failed retest of 47.14 with negative divergence. Targets from 47.14 are 46.94, 46.57, 46.24, 46.04, 45.86, 45.45, and 45.04. Additional targets will be in the Members only portion of the morning blog, and in the live trading room.
If you’re interested in the live trading room, it is now primarily stock market futures content, though we do track heavily traded stocks and their likely daily trajectories as well – we begin at 9am with a morning report and likely chart movements along with trade setups for the day.
As long as the trader keeps himself aware of support and resistance levels, risk can be very adequately managed to play in either direction as bottom picking remains a behavior pattern that is developing with value buyers and speculative traders.
Twitter: @AnneMarieTrades
The author trades stock market futures every day and may have a position in mentioned securities at the time of publication. Any opinions expressed herein are solely those of the author, and do not in any way represent the views or opinions of any other person or entity.
: Creating Bullish Divergence?")


: Creating Bullish Divergence?")