S&P 500 futures trading outlook for June 2, 2016
The ES_F has held steady with buyers coming in at higher support levels near 2084. Supply above 2099 keeps us from advancing at this time and price action continues to squeeze.
Above 2099, we would have moved sellers out of the way and the chart should advance into 2102-2105, but with flat momentum, that is also questionable. Moving buyers out of the way near 2084 will allow price action to drift into 2071-2065; but as it stands, we seem to be caught here for now, with neither buyers nor sellers exercising enough pressure to force us out of the range.
See today’s economic calendar with a rundown of releases.
THE RANGE OF TUESDAY’S MOTION
E-mini S&P 500 Futures (ES_F)
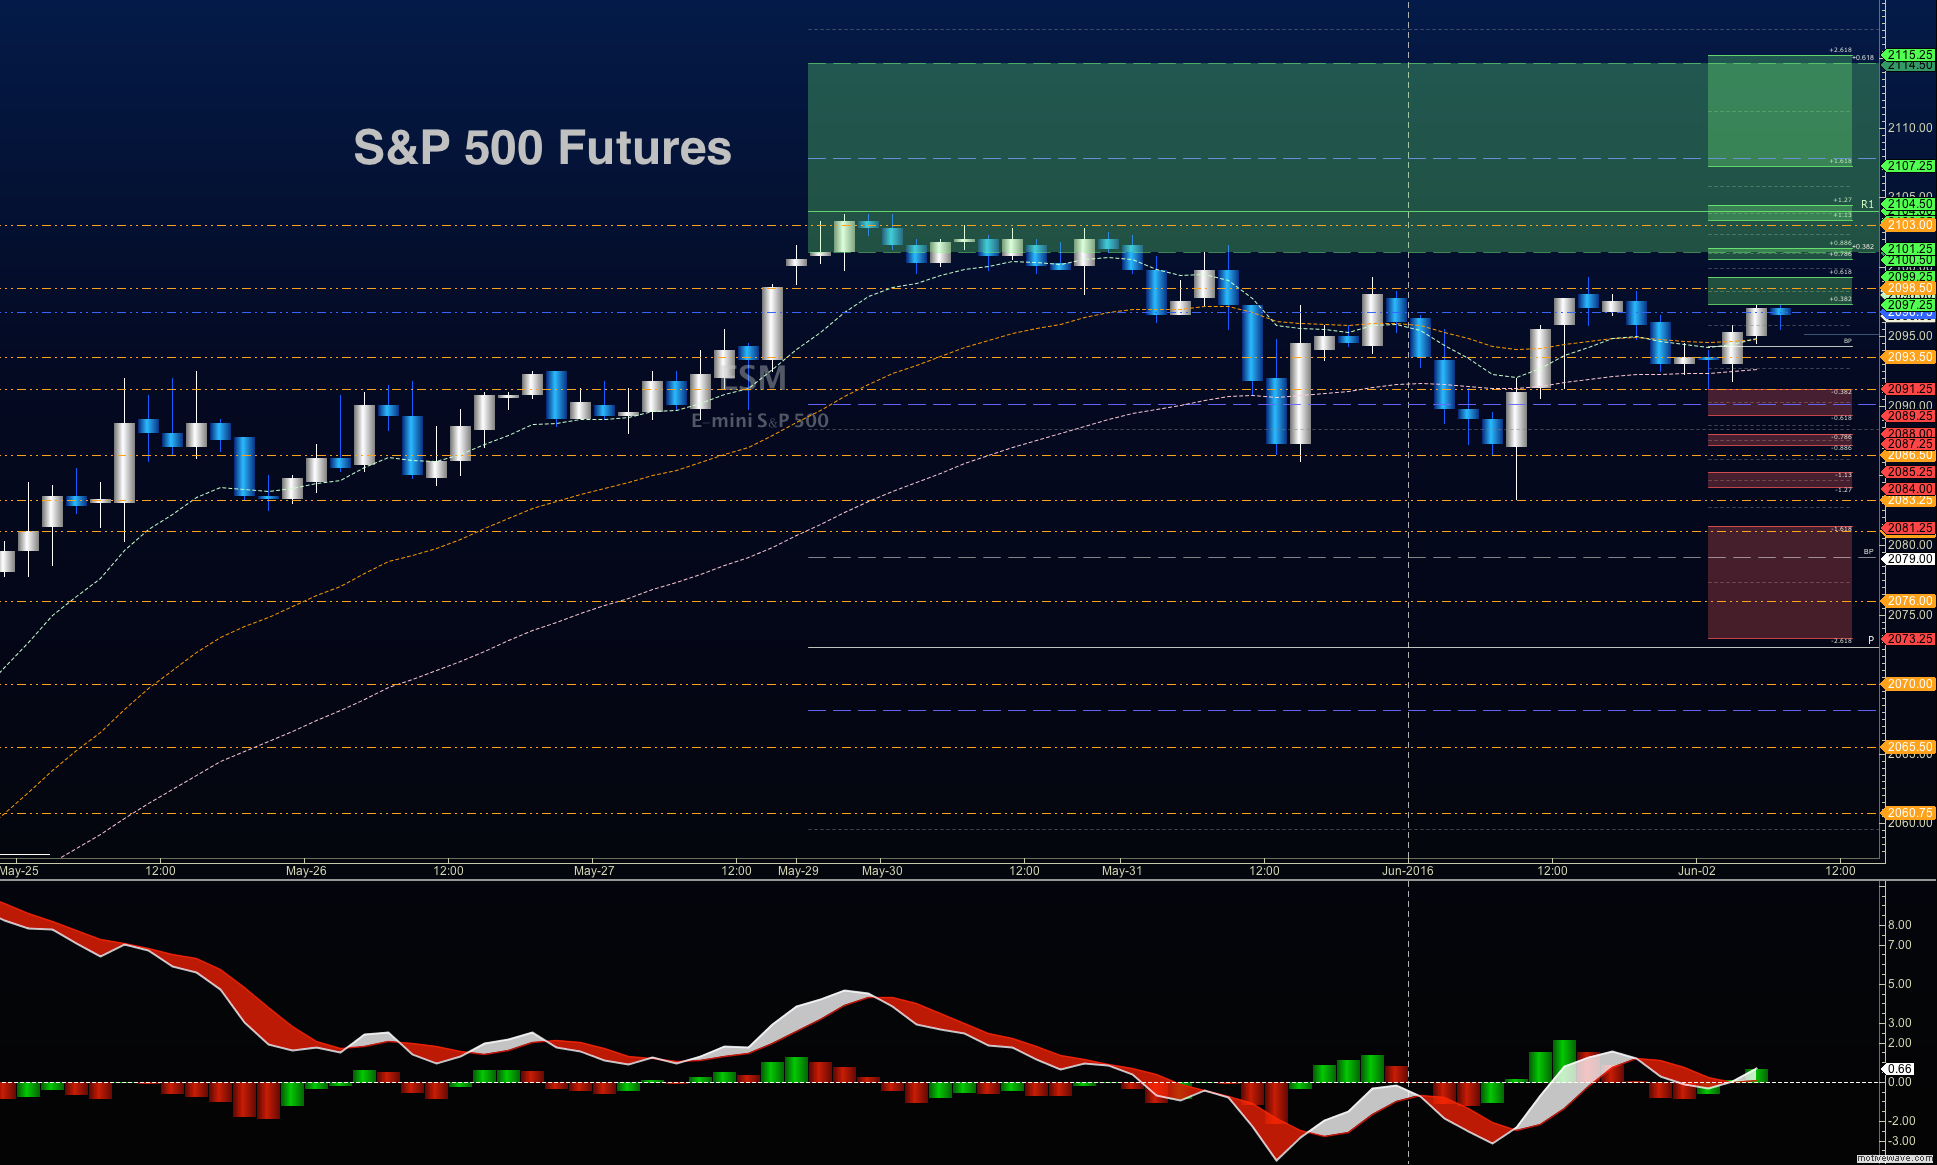
Outlook for June 2, 2016 –ADP, Jobless Claims today, Employment situation tomorrow. Range bound, charts continue to compete – buyers anchoring at 2084.5, and sellers at 2099. Edges can be traded in the opposite direction, with a close eye on momentum helping us with this trade
Upside trades – Favorable setups sit on the positive retest of 2099.25, or a positive retest of 2091.5 with positive momentum. I use the 30min to 1hr chart for the breach and retest mechanic. Targets from 2091.5 are 2086, 2088.25, 2094, 2096.75, 2098, 2099.25, and if perhaps 2101.25, 2103.75, and 2105.25 to 2107.5, if the shift of balance moves back to the buyers.
Downside trades- Favorable setups sit below the failed retest of 2090.5 or at the failed retest of 2096.5 with negative divergence. It is important to watch for higher lows to develop with the 2096.5 entry, if the strength of motion returns to the buyers. Retracement into lower levels from 2096.5 gives us the targets 2094.25, 2092, 2090.5, 2088.5, 2085.5, 2082.25, 2078.5, and perhaps back to 2077.5 to 2075.
Have a look at the Fibonacci levels marked in the blog for more targets.
Nasdaq Futures
Outlook for June 2, 2016 –The NQ_F continues a range bound formation that is tightening. Significant overhead supply sits between 4525 and 4529. Breaches above there will give buyers courage to advance price into 4535 – 4564.5, where we are likely to find sellers again. Buyers are giving us higher lows in the current formation. Bearish action will be amplified below the failed retest of 4508, but the first break down will find buyers in a bounce to resistance. The failed resistance test at 4508 gives us more downside exposure.
Upside trades – Favorable setups sit on the positive retest of 4525.25, or a positive retest of 4508.5 with positive momentum. I use the 30min to 1hr chart for the breach and retest mechanic. Watch for the lower high to develop, and sellers to force the chart down, if sellers take hold near the 4514 test from below. Targets from 4508.5 are 4513.5, 4518.25, 4524.75, 4528.25, 4535.5, 4544.75, 4550.75, and 4555.25. Range expansions above here should fail, but could stretch into 4580.
Downside trades- Favorable setups sit below the failed retest of 4507.5 or at the failed retest of 4520 with negative divergence. Retracement into lower levels from 4520 gives us the targets 4514.5, 4511.5, 4508.5, 4502.5, 4497.5, 4479.5, 4472.25, 4464.75, 4451.25, and perhaps 4434.5 – but those deep levels only come about if we have a real shift of momentum.
Oil
Outlook for June 2, 2016 -CL_F –OPEC meeting in Vienna in full swing as well as an ECB rate decision. EIA report today. API yesterday shows build of 2.4mm.
Trading range suggests support action near 46.7, and resistance behavior near 49.98.
Upside trades can be staged on the positive retest of 49.3, or after a dip into 48.9. If the chart dips sharply into 47.75 again, buyers will lurk there as well. I often use the 30min to 1hr chart for the breach and retest mechanic. Targets from 47.75 are 47.94, 48.23, 48.41, 48.63, 48.82, 49.04, 49.14, 49.32, 49.57, 49.74, 49.97, and 50.04. Range expansion could occur here on OPEC news, or on a surprise EIA number. Those resistance levels above are 50.6, 50.92, and 51.41, but price is very likely to fail there.
Downside trades can be staged on the failed retest of 48.7, or at the failed retest of 49.7 with negative divergence. These setups give us targets from 49.7 into 49.6, 49.34, 49.05, 48.86, 48.7, 48.49, 48.27, 47.97, and perhaps 47.68 to 47.24.
Visit TheTradingBook.com for more information.
If you’re interested in the live trading room, it is now primarily stock market futures content, though we do track heavily traded stocks and their likely daily trajectories as well – we begin at 9am with a morning report and likely chart movements along with trade setups for the day.
As long as the trader keeps himself aware of support and resistance levels, risk can be very adequately managed to play in either direction as bottom picking remains a behavior pattern that is developing with value buyers and speculative traders.
Twitter: @AnneMarieTrades
The author trades stock market futures every day and may have a position in mentioned securities at the time of publication. Any opinions expressed herein are solely those of the author, and do not in any way represent the views or opinions of any other person or entity.


