Stock Market Futures Considerations For June 16, 2017
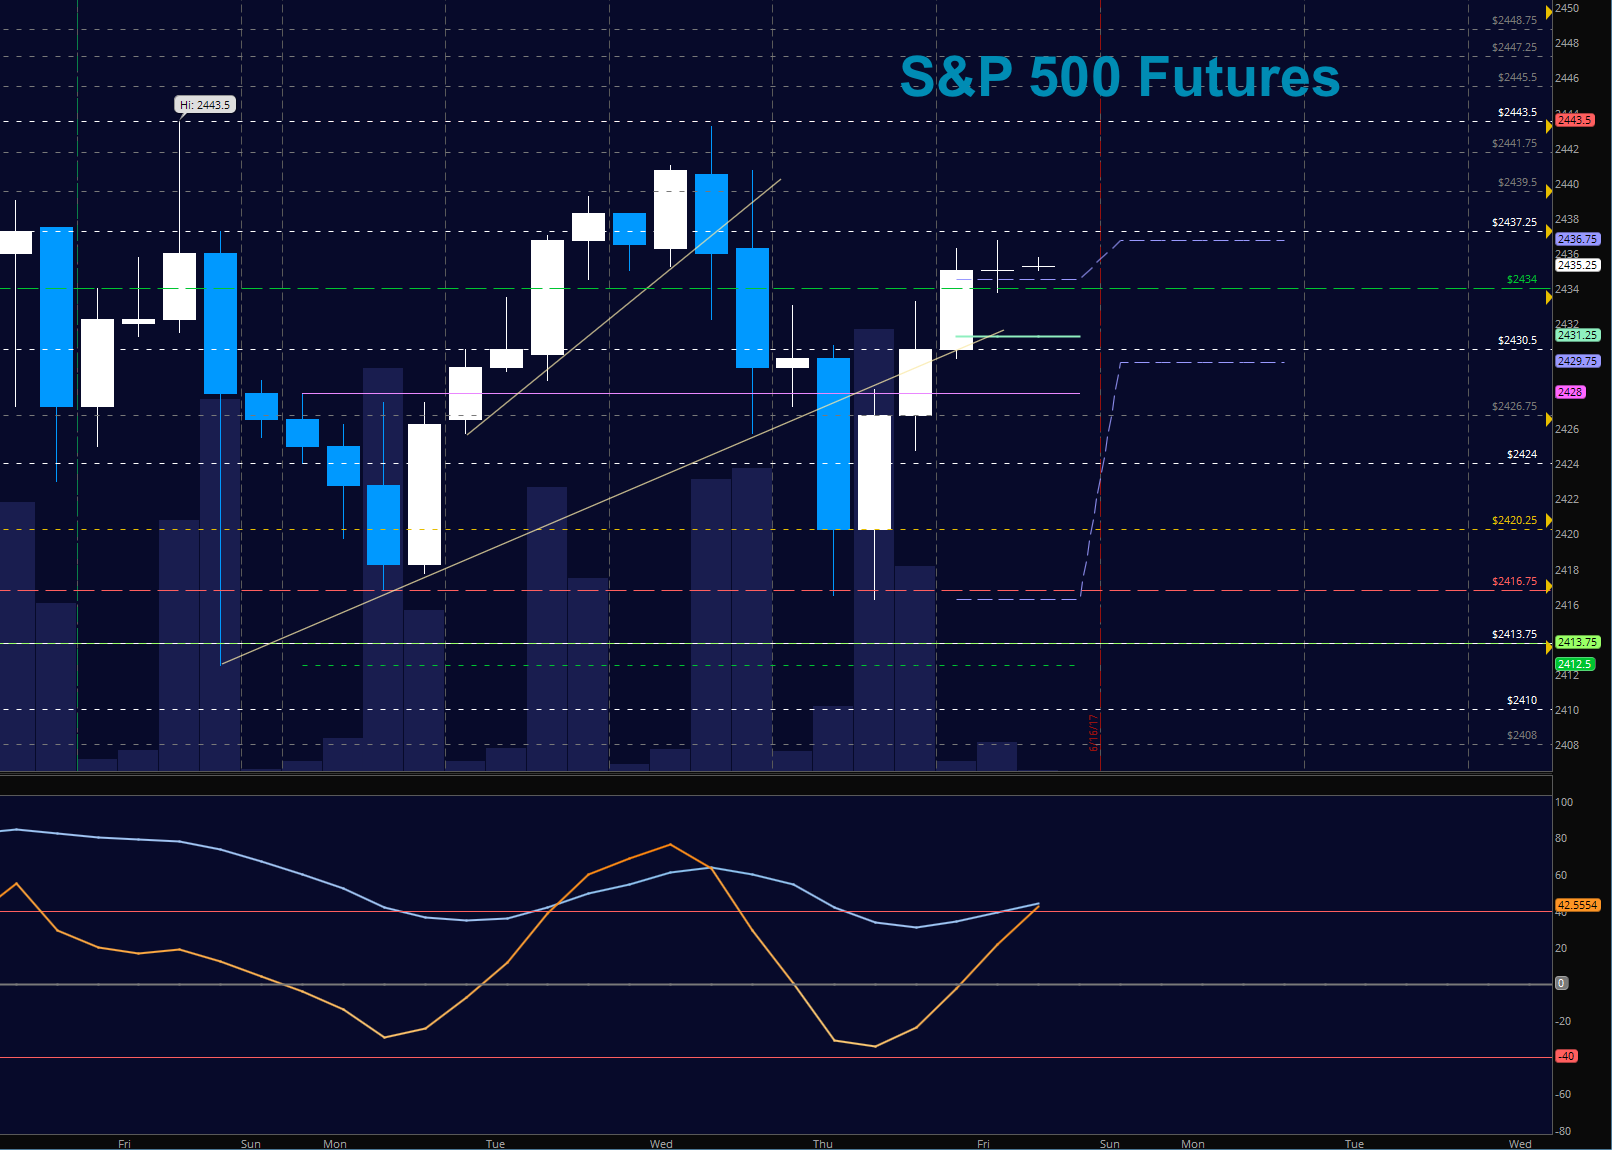
Zigzag pattern shows range bound motion on the S&P 500 () chart into Friday’s expiration. We are near the top of the range and resistance sits near 2437.5 to 2440.
Check out today’s economic calendar with a full rundown of releases. And note that the charts below are from our premium service at The Trading Book and are shared exclusively with See It Market readers.
S&P 500 Futures (ES)
Breakouts seem likely with a run of stops ahead, and a fade to higher lows. Support intraday has shifted up to 2426. The bullets below represent the likely shift of trading momentum at the positive or failed retests at the levels noted.
- Buying pressure intraday will likely strengthen above a positive retest of 2437.5
- Selling pressure intraday will likely strengthen with a failed retest of 2426
- Resistance sits near 2437.5 to 2440, with 2443.75 and 2449.5 above that.
- Support holds between 2426.5 and 2420.25, with 2416.75 and 2412.5 below that.
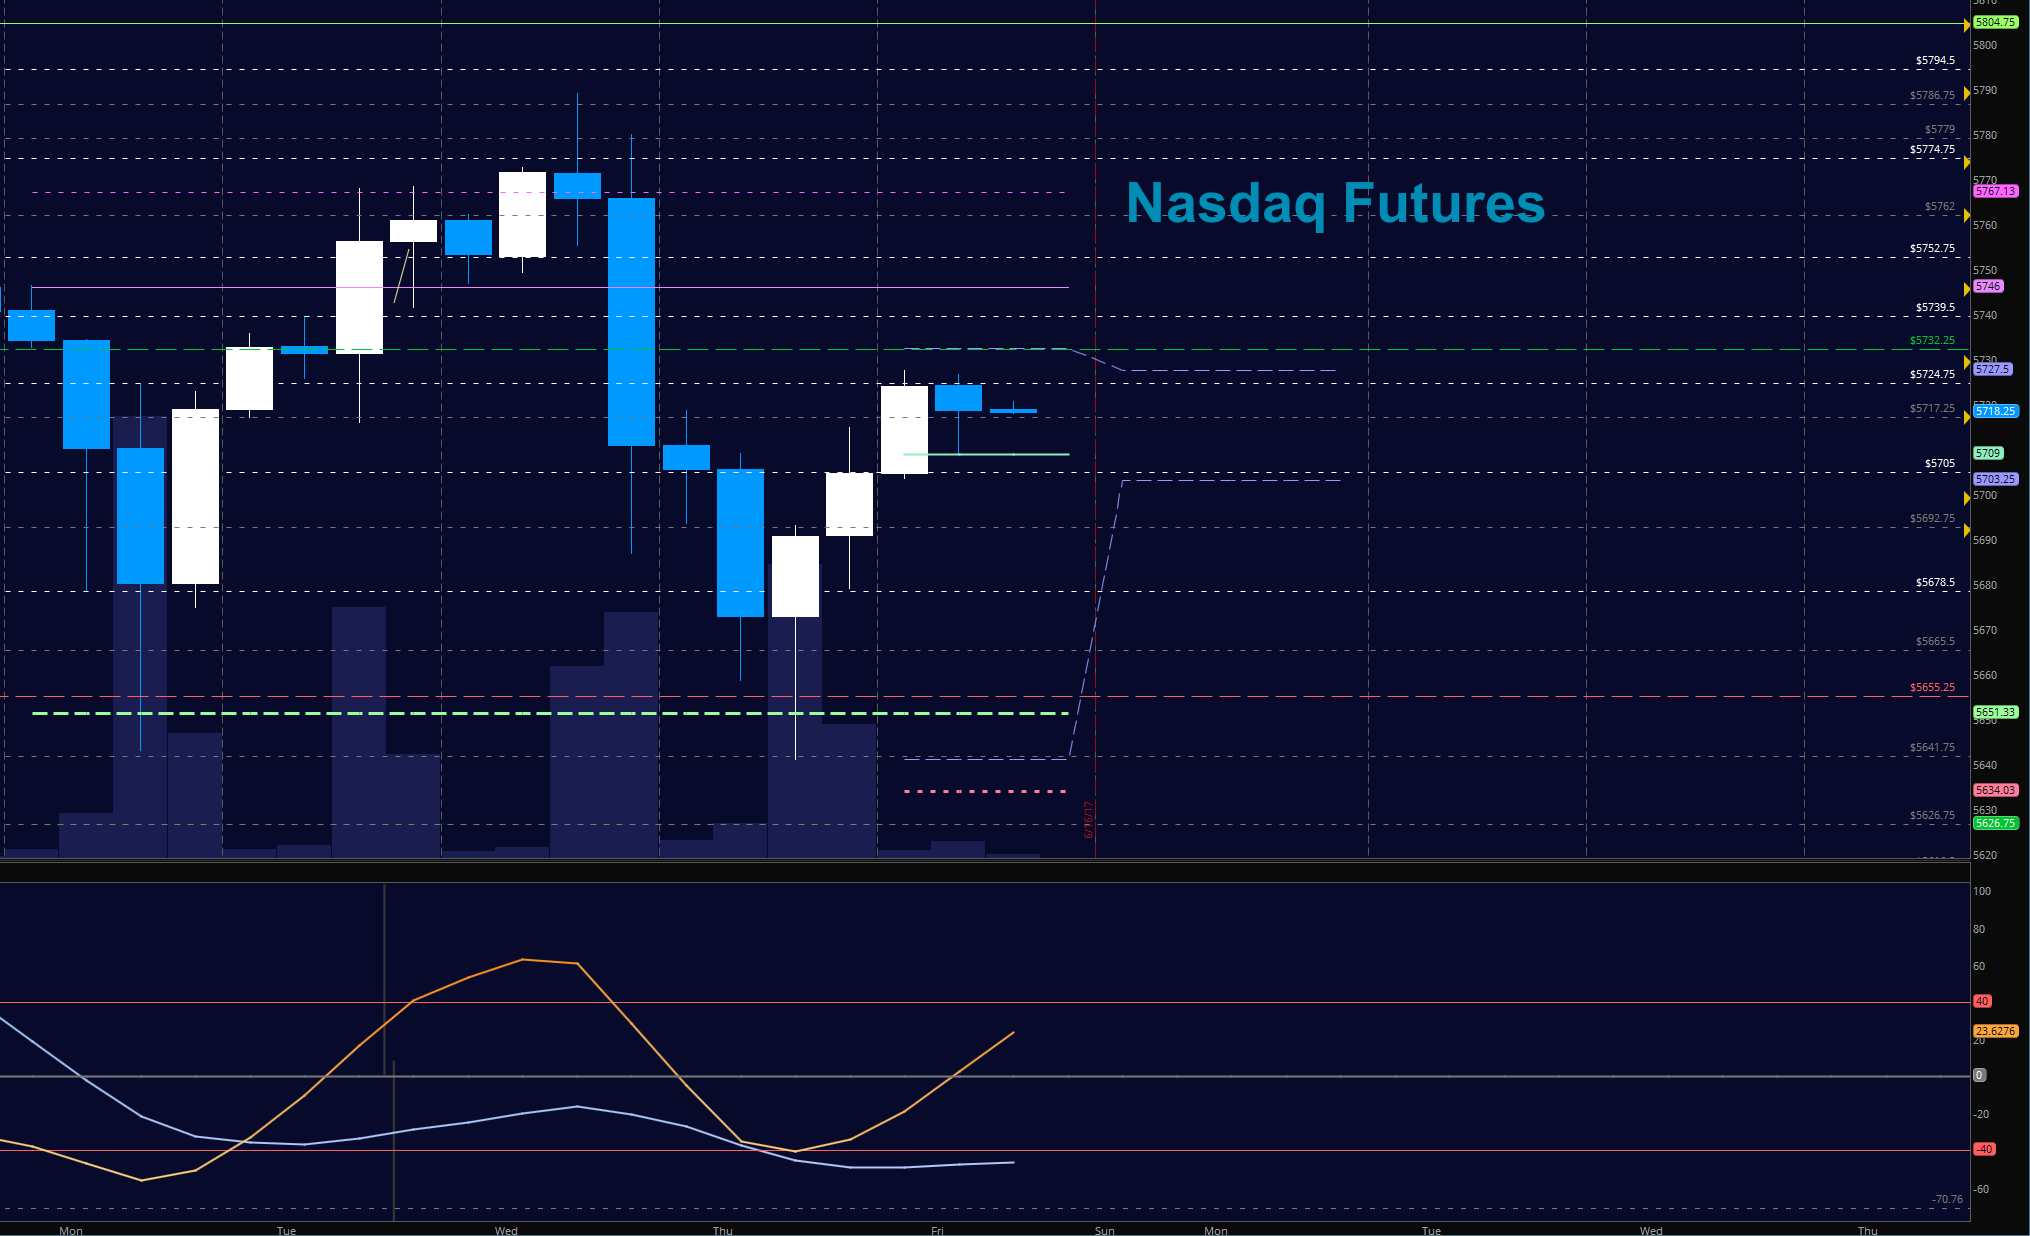
NASDAQ Futures
In big moves off a bounce near the lows, the NQ now sits near resistance at 5724.75. Above 5716, charts will hold a bullish slant, but breakouts are not wise to chase unless going after near term targets or using a very wide stop. Key resistance now sits between 5723 and 5746. Support sits near 5705. The bullets below represent the likely shift of intraday trading momentum at the positive or failed tests at the levels noted.
- Buying pressure intraday will likely strengthen with a positive retest of 5727
- Selling pressure intraday will likely strengthen with a failed retest of 5697.5
- Resistance sits near 5724.75 to 5727, with 5732.75 and 5746.5 above that.
- Support holds between 5709.25 and 5705.5, with 5697 and 5692 below that.
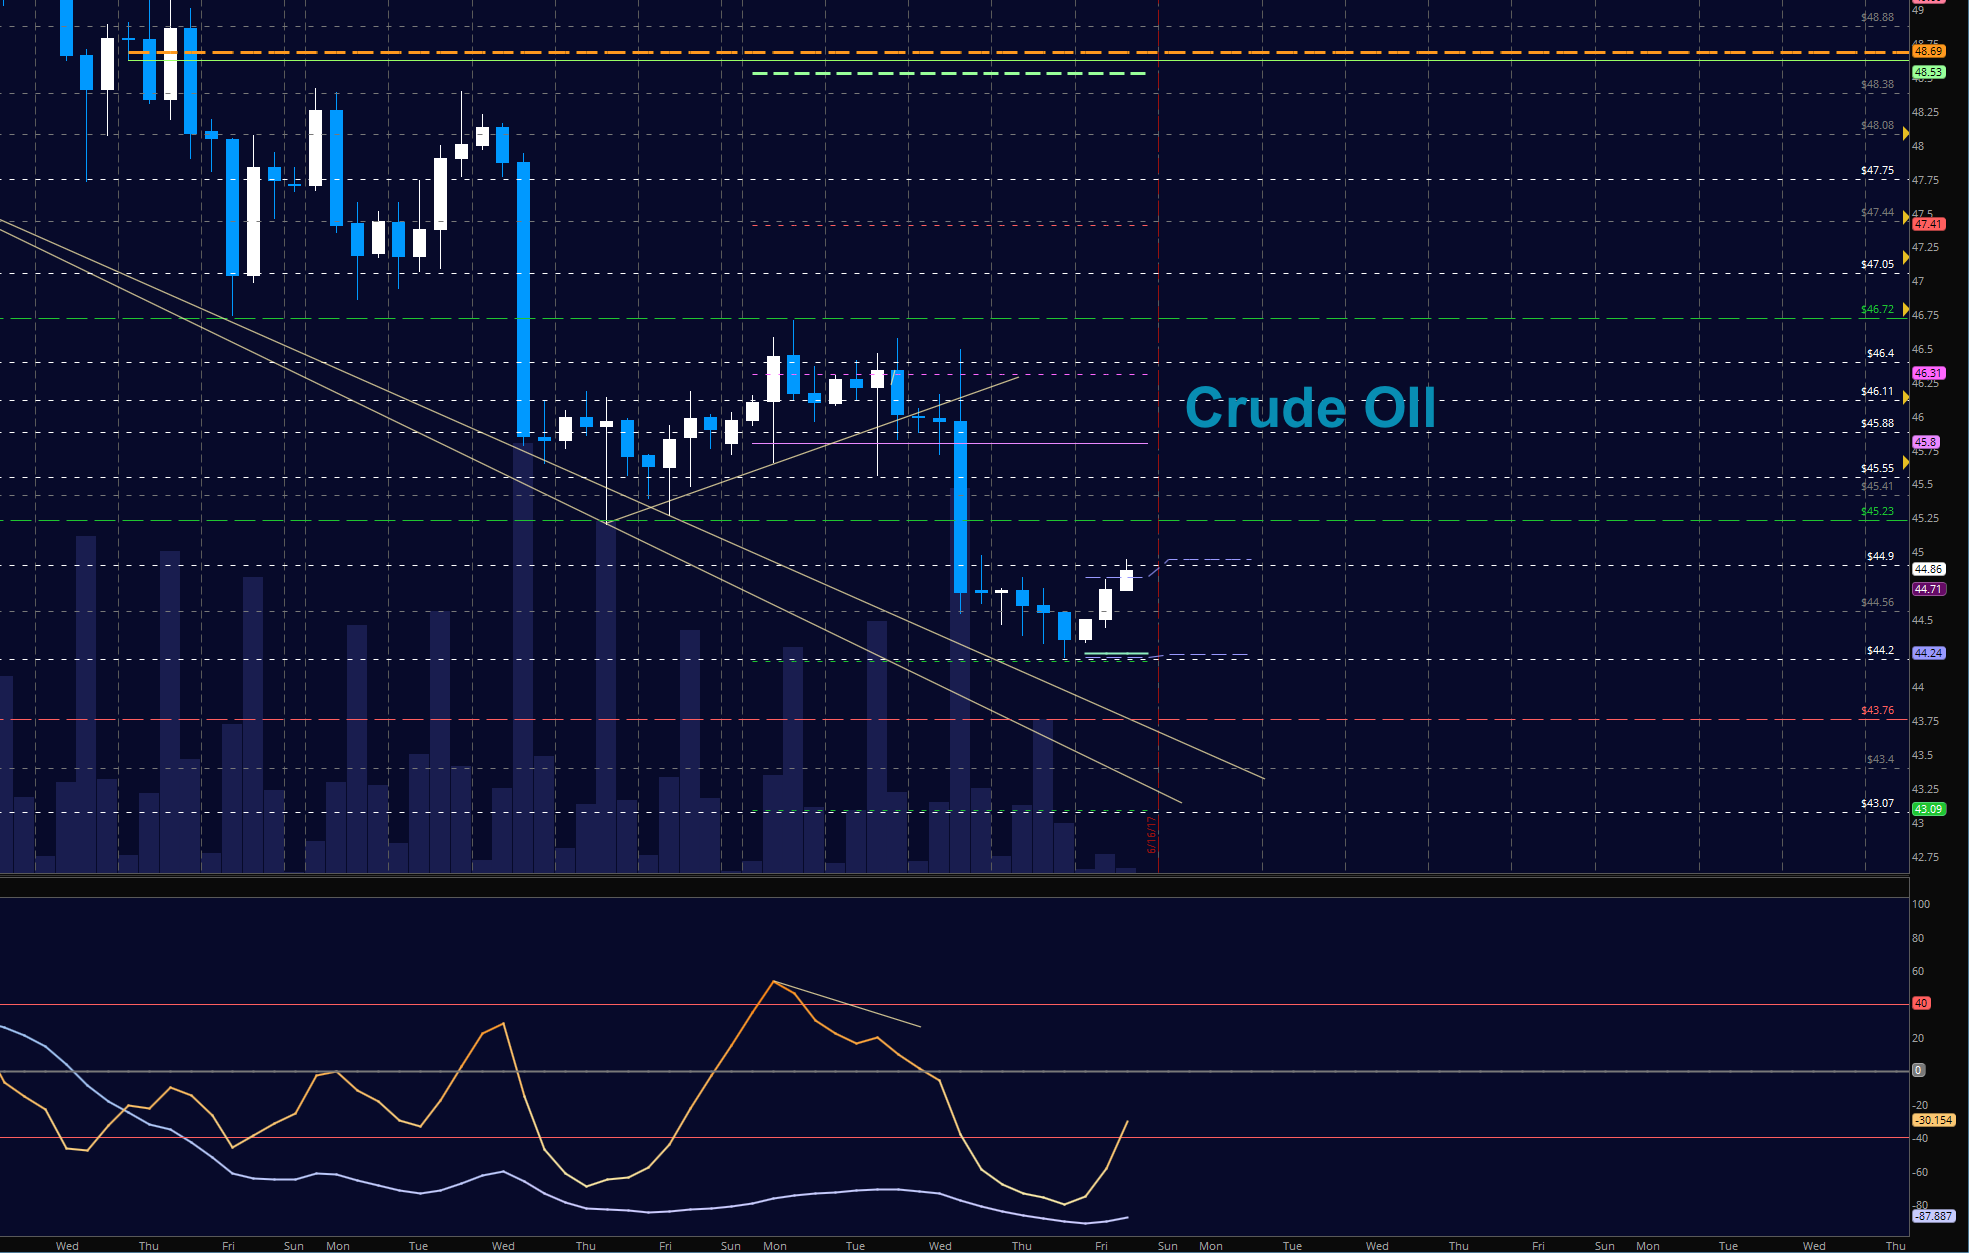
WTI Crude Oil
After a dip into 44.3, our first line of support yesterday, we sat sideways for hours before bouncing into a probable test of 45.23 to the familiar 45.55. Funds definitely put out quite a bit of money holding the support levels, but without a breach and hold of 44.9, traders are likely to force price back to support regions near 44.56 The bullets below represent the likely shift of trading momentum at the positive or failed tests at the levels noted.
- Buying pressure intraday will likely strengthen with a positive retest of 44.94
- Selling pressure intraday will strengthen with a failed retest of 44.2
- Resistance sits near 45.23 to 45.57, with 46.11 and 46.4 above that.
- Support holds between 44.2 to 44.03, with 43.8 and 43.4 below that.
Our live trading room is now primarily stock market futures content, though we do track heavily traded stocks and their likely daily trajectories as well – we begin at 9am with a morning report and likely chart movements along with trade setups for the day.
As long as the trader keeps himself aware of support and resistance levels, risk can be very adequately managed to play in either direction as bottom picking remains a behavior pattern that is developing with value buyers and speculative traders.
Twitter: @AnneMarieTrades
The author trades stock market futures every day and may have a position in mentioned securities at the time of publication. Any opinions expressed herein are solely those of the author, and do not in any way represent the views or opinions of any other person or entity.


