Stock Market Considerations For July 31, 2017
Some volatility late last week has to be on traders minds as the markets attempt to move higher. The S&P 500 (INDEXSP:.INX) still has some overhead resistance to deal with that traders will want to be aware of. See key futures trading levels below for the S&P 500, Nasdaq, and crude oil.
Check out today’s economic calendar with a full rundown of releases. And note that the charts below are from our premium service and shared exclusively with See It Market readers.
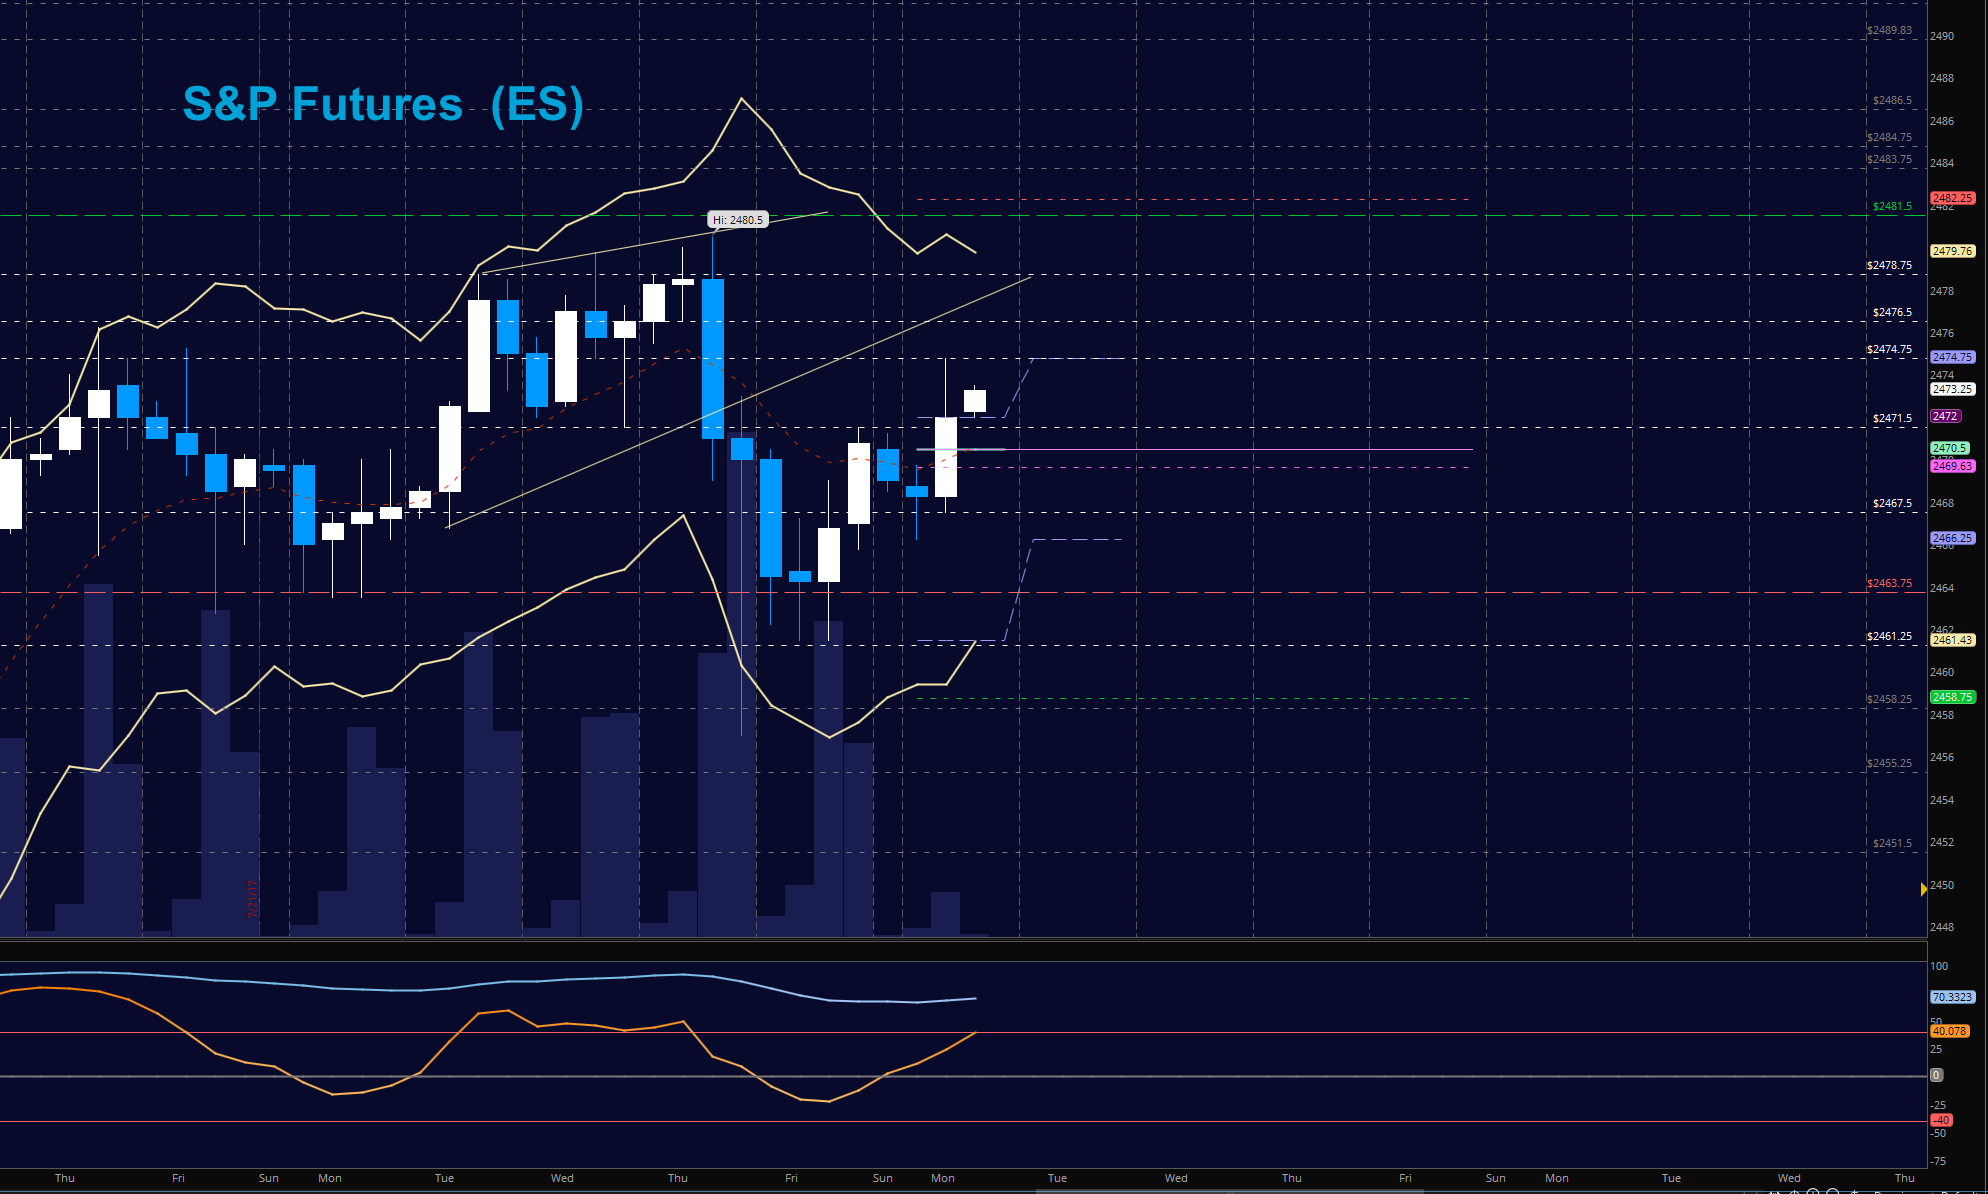
S&P 500 Futures (ES)
Markets trace higher in the early morning but fade slightly into congestion. We are holding support levels of interest near 2471. Resistance is near 2478 as earnings season continues. The bullets below represent the likely shift of trading momentum at the positive or failed retests at the levels noted.
- Buying pressure intradaywill likely strengthen above a positive retest of 2474.75 (careful again here with resistance)
- Sellingpressure intraday will likely strengthen with a failed retest of 2469.5
- Resistance sits near 2474.75 to 2476.5, with 2480.75 and 2483.75 above that.
- Support holds between 2470.5 and 2466.5, with 2463.5 and 2458.75 below that.
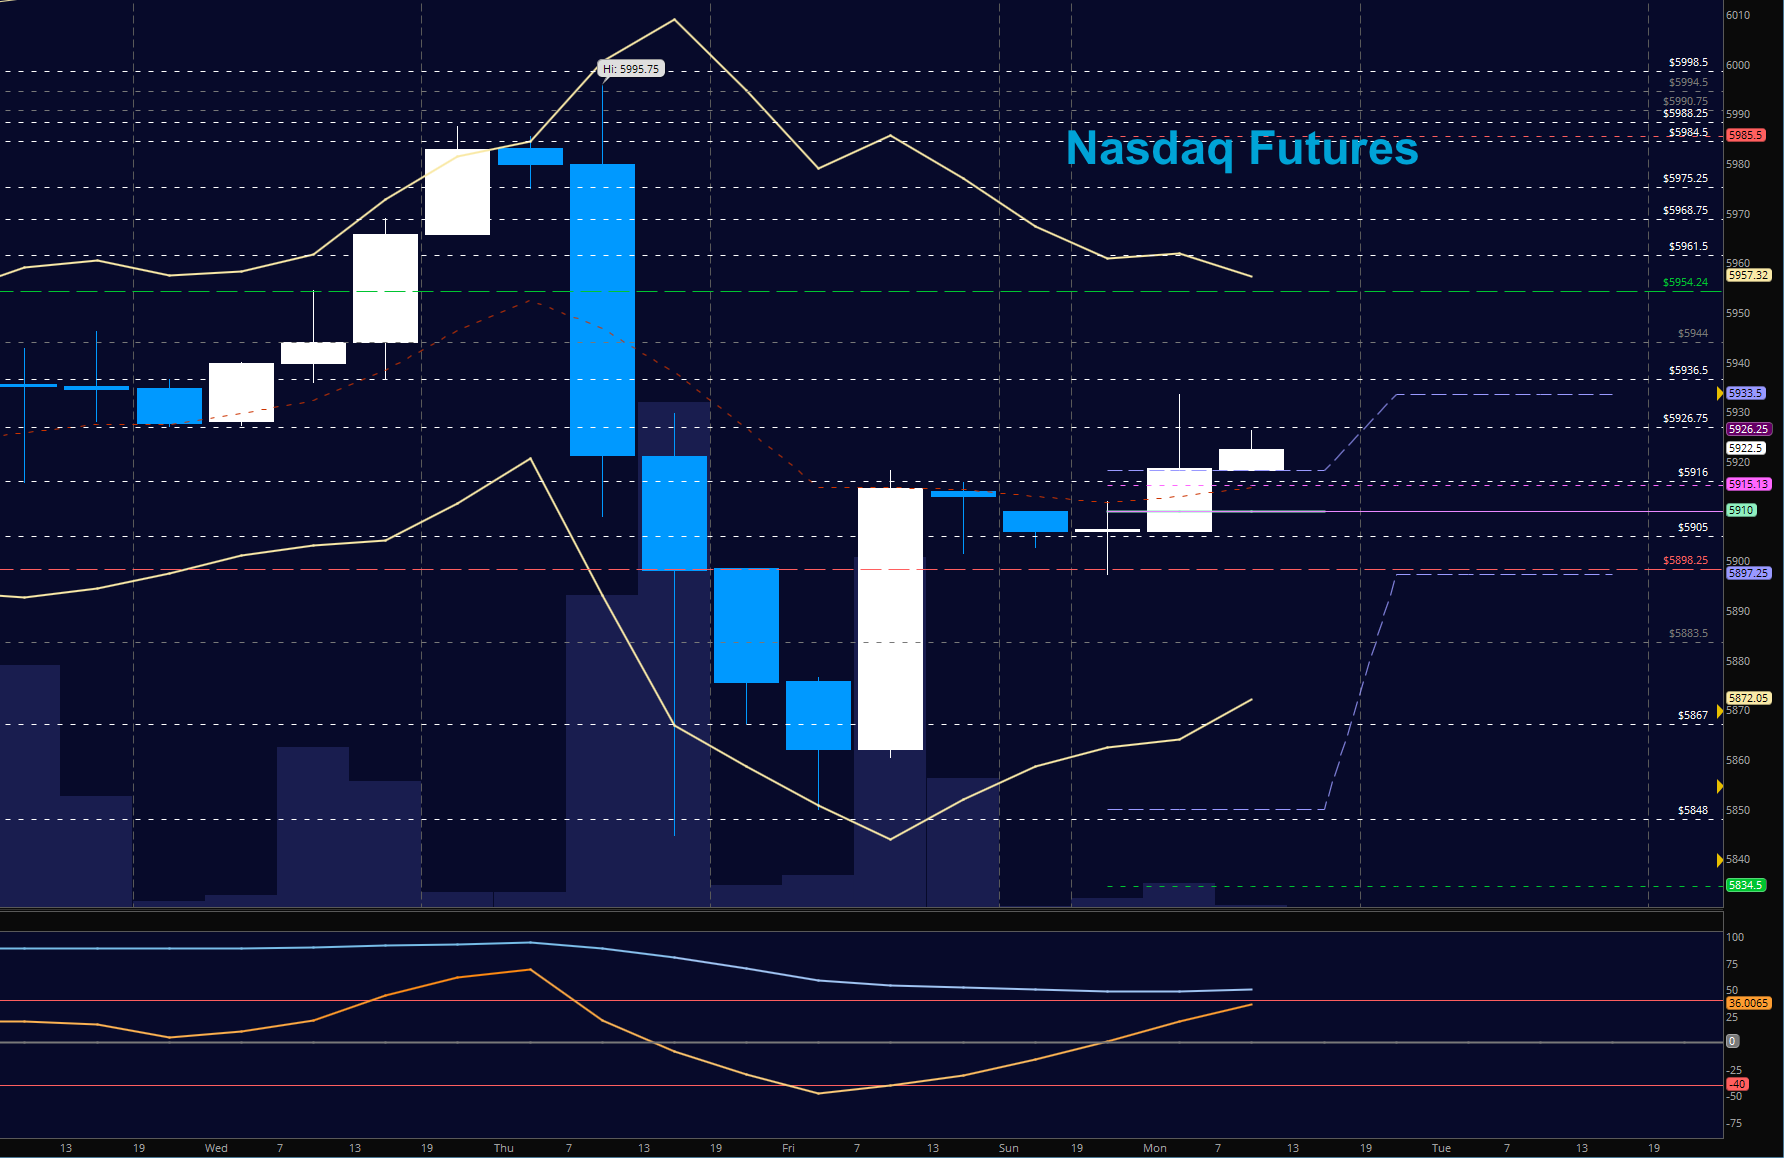
NASDAQ Futures
Our trajectory for Friday was spot on- giving us the ground work to establish either higher lows or a breakdown back into negative areas. We held nicely and buyers are now in a battle with sellers positioned near 5927. Momentum is positive once again, suggesting that pullbacks will give us higher lows. The support line in the sand is near 5897. The bullets below represent the likely shift of intraday trading momentum at the positive or failed tests at the levels noted.
- Buyingpressure intraday will likely strengthen with a positive retest of 5930
- Sellingpressure intraday will likely strengthen with a failed retest of 5897
- Resistance sits near 5929.5 to 5936.5, with 5946.75 and 5961.75 above that.
- Support holds between 5901.5 and 5897.5, with 5881.5 and 5857.5 below that.
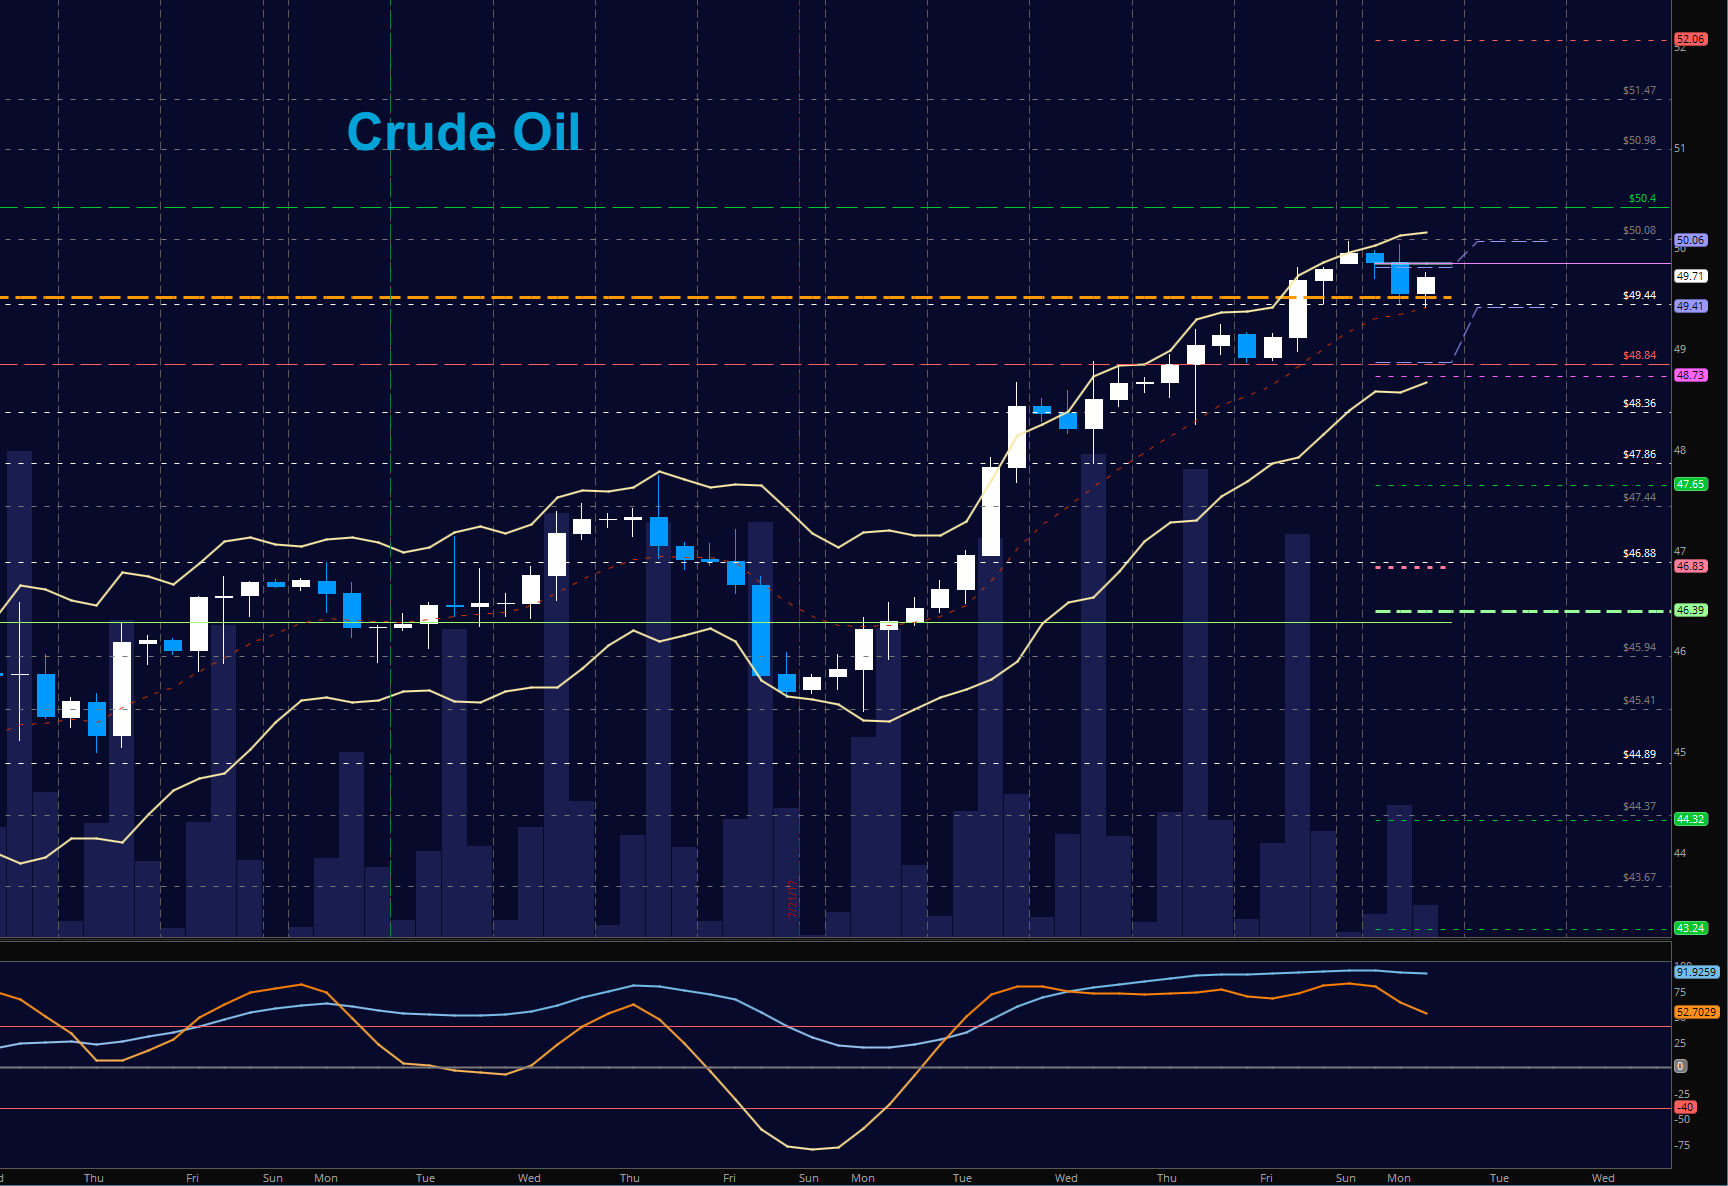
WTI Crude Oil
Hedge funds increased their long exposure through last week as we saw prices continue to rise through the week. Bullish formations still hold here with the support zone to watch being 48.82. Pullbacks will continue to hold regions for buyers to engage. Momentum is mixed but still bullish. Above 49.84, we’ll likely retest 50.06 and above that lies 50.4 and 50.98 to 51.47 as the next test areas. The bullets below represent the likely shift of trading momentum at the positive or failed tests at the levels noted.
- Buyingpressure intraday will likely strengthen with a positive retest of 49.84
- Sellingpressure intraday will strengthen with a failed retest of 48.7
- Resistance sits near 49.67 to 49.8, with 50.06 and 50.44 above that
Support holds between 48.84 to 48.47, with 48.32 and 47.86 below that.
If you’re interested in watching these trades go live, join us in the live trading room from 9am to 11:30am each trading day. Visit TheTradingBook for more information.
If you’re interested in the live trading room, it is now primarily stock market futures content, though we do track heavily traded stocks and their likely daily trajectories as well – we begin at 9am with a morning report and likely chart movements along with trade setups for the day.
As long as the trader keeps himself aware of support and resistance levels, risk can be very adequately managed to play in either direction as bottom picking remains a behavior pattern that is developing with value buyers and speculative traders.
Twitter: @AnneMarieTrades
The author trades stock market futures every day and may have a position in mentioned securities at the time of publication. Any opinions expressed herein are solely those of the author, and do not in any way represent the views or opinions of any other person or entity.


