S&P 500 Futures Broad Market Overview for July 28, 2016 – The Federal Open Market Committee (FOMC) release yesterday did little to shake the charts from their congested levels. Though we dipped deeply into support, once again, a tradable buying opportunity was at hand. Early morning S&P 500 futures trading saw a test of the upper edges of this range but they have since fallen back. It looks like another quiet open for the S&P 500 Index (INDEXSP:.INX).
Flattening moving averages are worth. Resistance is between 2172.5 and 2177.25, but we could breach into 2183.25, and even 2189.75 if there are lots of stops sitting above us, and we begin a breakout. Breaches should still fade back to higher breakout levels with momentum being a bit damp. Support to watch below is 2151.5, but we hold a much higher overnight low of 2161.25. Buyers continue to have trouble getting past overhead supply, and sellers have been held at bay along support lines between 2151 and 2155.
See today’s economic calendar with a rundown of releases.
RANGE OF TODAY’S MOTION
S&P 500 Futures Trading Chart (ES_F) – July 28
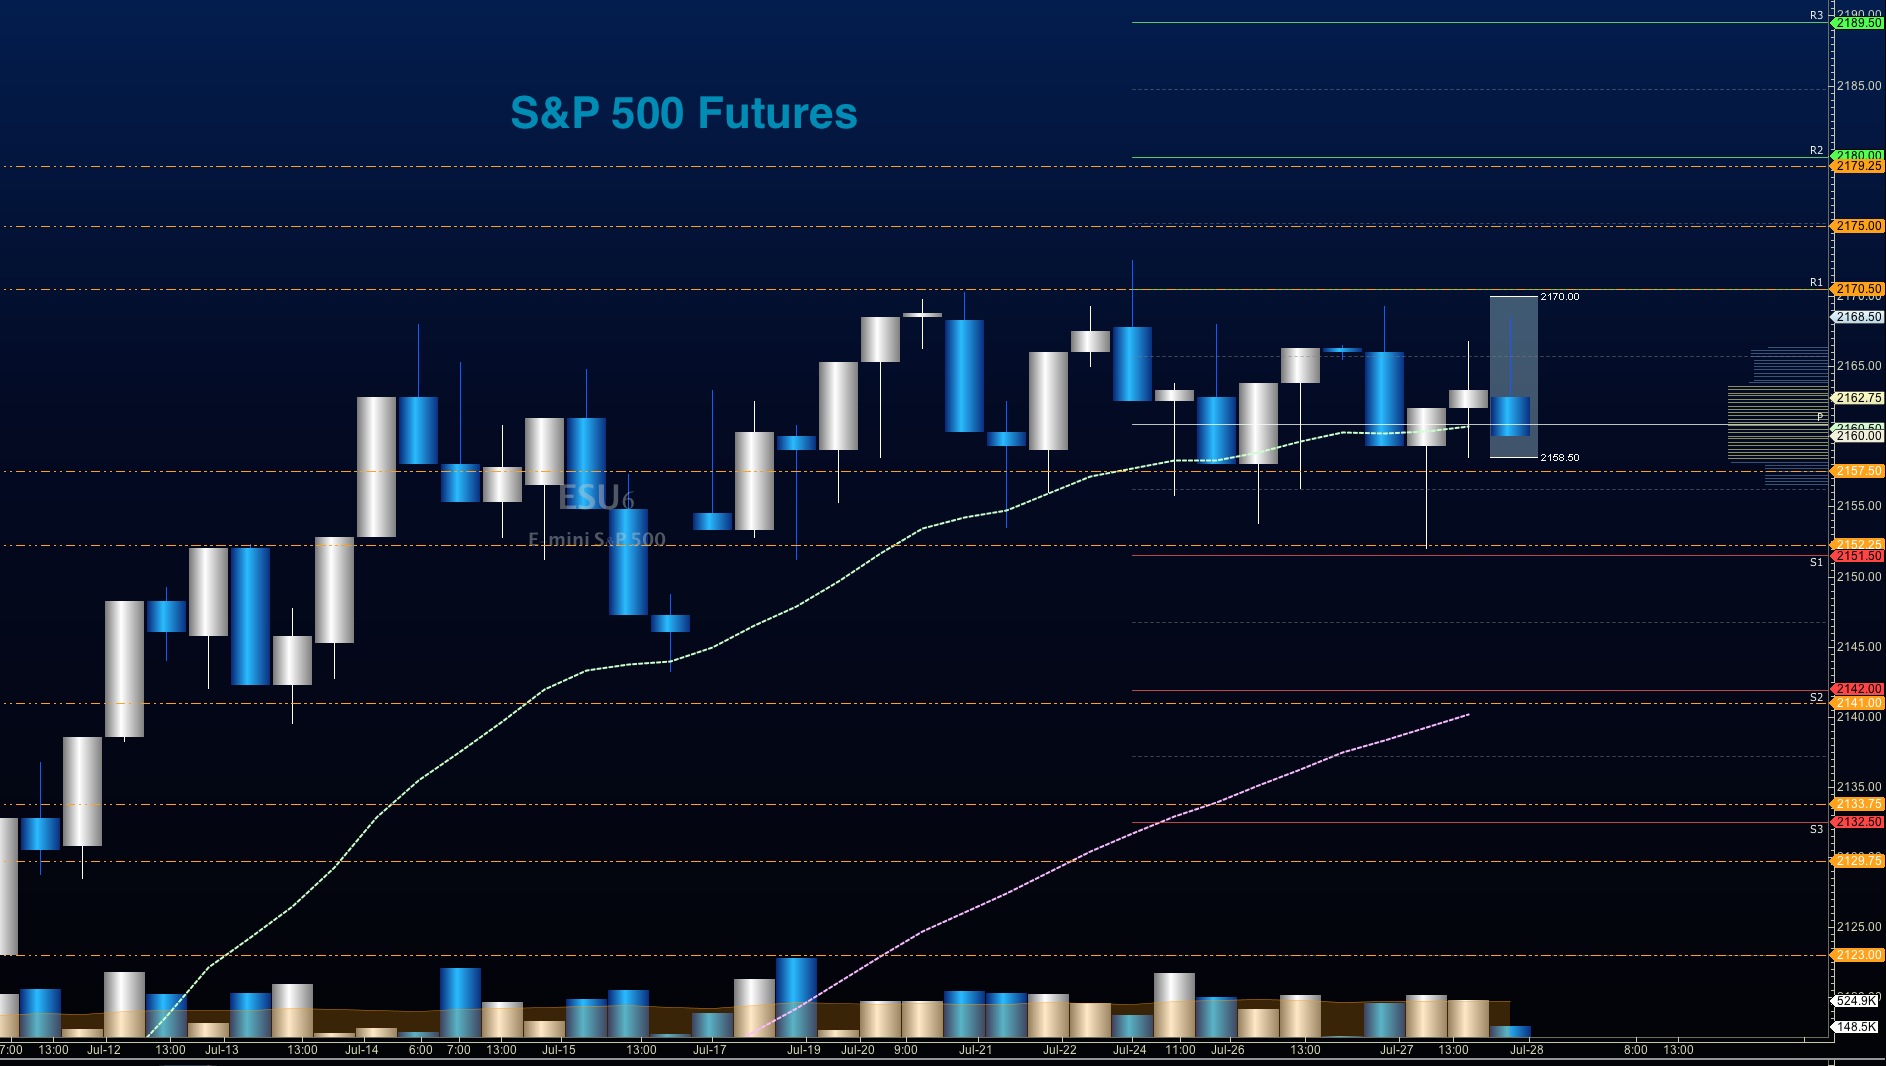
Upside trades in S&P 500 futures trading – Favorable setups sit on the positive retest of 2166.5, or a positive retest of the bounce off 2162.75 with positive momentum. Remember that the feel of the chart is congestion, so breakouts will be difficult to maintain. I use the 30min to 1hr chart for the breach and retest mechanic. Targets from 2161.5 are 2164.5, 2166.5, 2171.25, 2175.75, 2177.25, 2179.25, 2180.25, and if we expand, we may stretch above into 2183.75 and 2189.75.
Downside trades in S&P 500 futures trading – Favorable setups sit below the failed retest of 2161.25 or at the first failed retest of 2165.75 with negative divergence. As this is still a relatively countertrend trade keep your eyes on the lookout for higher lows developing intraday. Retracement into lower levels from 2165.75 gives us the targets 2163.5, 2061.5, 2158.25, 2156, 2153.5, 2149.75, 2145.75, 2143, 2141.75, 2138.75, and 2136.75 to 2128.25, if sellers take over.
If you’re interested in watching these trades go live, join us in the live trading room from 9am to 11:30am each trading day.
Nasdaq Futures
The NQ_F broke above the 4719 target overnight but has since retraced into congestion near 4709.25. This chart is much more bullish than the ES_F, but as it breaches yearly highs, it is more likely to begin a bit more sideways action. New support near 4674-4678, with a lower break into 4648-4650, if sellers gain traction. Resistance levels are now between 4716-4727, and above that, 4739.5 – a level we made late last year. Breaches should retest before any real expansion holds (as the chart is doing right now), with new support near 4703.
Upside trades in Nasdaq futures trading – Favorable setups sit on the positive retest of 4716, or a positive retest of 4703 with positive momentum. I use the 30min to 1hr chart for the breach and retest mechanic. Watch for the lower high to develop with this range break, if sellers exercise more power intraday. Targets from 4703 are 4705.25, 4707.25, 4710.25, 4714.25, 4717.25, 4721, 4723.75, 4727.75, 4734.5, and 4739.5, if buyers continue the rally north.
Downside trades in Nasdaq futures trading – Favorable setups sit below the failed retest of 4702, or at the failed retest of 4714 with negative divergence. Watch those moving averages and trend lines when taking the shorts. Retracement into lower levels from 4714 gives us the targets 4711.75, 4708.5, 4705.75, 4703, 4698.75, 4693.75, 4691.25, 4687.75, 4682.75, 4678.5, 4664.75, 4660.25, 4658.5, 4655.25, 4651.75, and 4645.5 to 4642.5, if sellers resume control.
Crude Oil
The EIA report yesterday showed a build of over 1.6MM, leading to another slide down into targets near 41.65. Momentum is negative as buyers try a bounce off support of 41.65, but sellers are likely to force price back down from 42.25 to 42.6. There is a lower level test near 40.7, and below that 40.46 – if buyers cannot assume control here.
Trading ranges for crude oil should hover between 41.19 and 42.76.
Upside trades in crude oil futures can be staged on the positive retest of 42.24, or at a bounce off 41.65 with positive momentum. I often use the 30min to 1hr chart for the breach and retest mechanic. Targets from 41.65 are 41.92, 42.16, 42.29, 42.45, 42.78, 42.97, 43.18, 43.3, 43.47, 43.68, 43.83, 44.02, 44.22, 44.49, and perhaps, 44.71, if buyers really take control.
Downside trades in crude oil futures can be staged on the failed retest of 41.6, or at the failed retest of 42.16 with negative divergence. Targets from 42.16 are 41.92, 41.76, 41.61, 41.44, 41.19, 40.94, and perhaps 40.73.
If you’re interested in the live trading room, it is now primarily stock market futures content, though we do track heavily traded stocks and their likely daily trajectories as well – we begin at 9am with a morning report and likely chart movements along with trade setups for the day.
As long as the trader keeps himself aware of support and resistance levels, risk can be very adequately managed to play in either direction as bottom picking remains a behavior pattern that is developing with value buyers and speculative traders.
Twitter: @AnneMarieTrades
The author trades stock market futures every day and may have a position in mentioned securities at the time of publication. Any opinions expressed herein are solely those of the author, and do not in any way represent the views or opinions of any other person or entity.


