Stock Market Futures Considerations And Overview For January 23, 2017
Friday’s low on S&P 500 futures broke overnight but has recovered in choppy fashion. Momentum has dipped lower but remains in the confines of the congestion. The S&P 500 (INDEXSP:.INX) has made lower highs and lower lows since the hourly 9am Friday candle, breaking the pattern by time and not price over the Globex hours.
Buying pressure will likely strengthen above a positive retest of 2269.75, while selling pressure will strengthen with a failed retest of 2257.25.
Price resistance sits near 2269.75 to 2272.75, with 2274.5 and 2279.5 above that. And price support holds between 2257.25- 2254, with 2249.75 and 2246.50 below that.
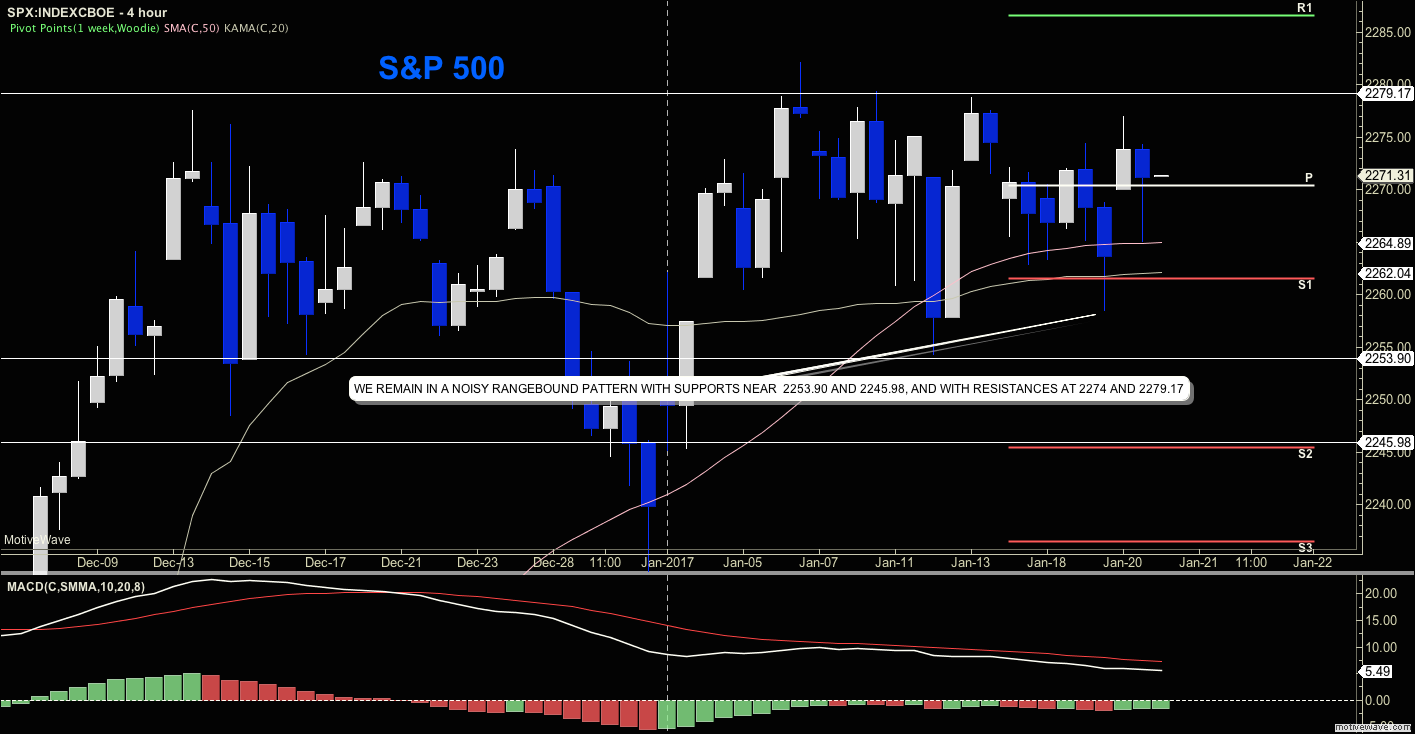
See today’s economic calendar with a rundown of releases, as well as a chart of the S&P 500 Index (below).
RANGE OF TODAY’S MOTION
E-mini S&P Futures
Upside trades – Two options for entry
- Positive retest of continuation level – 2266.75 (watch for 2269-2272.25 for possible resistance)
- Positive retest of support level – 2260.25
- Opening targets ranges – 2263.75, 2266.75, 2269.75, 2272.75, 2275.5, 2277, 2280.25, 2282.50, and 2285.25
Downside trades – Two options for entry
- Failed retest of resistance level – 2266
- Failed retest of support level – 2258.5
- Opening target ranges – 2263.5, 2260.25, 2257.25, 2254, 2251.75, 2249.75, 2246.50, 2242.75, and 2239.75
Nasdaq Futures
The NQ_F has followed the ES_F pattern of lower highs and lower lows – it, too, remains congested and noisy with momentum quite a bit lower than it has been prior. We have also broken the form by time and not price here.
Buying pressure will likely strengthen with a positive retest of 5059.5, while selling pressure will strengthen with a failed retest of 5036.25.
Price resistance sits near 5063.25 to 5069.75, with 5074.5 and 5083.75 above that. Price support holds between 5037 and 5032, with 5027.75 and 5014.25 below that.
Upside trades – Two options
- Positive retest of continuation level – 5051 (needs confirmation on tight time frame and watch for 5053.5-5055 for potential sellers)
- Positive retest of support level – 5042.75
- Opening target ranges – 5047.75, 5050.75, 5055, 5059.5, 5063.25, 5066, 5069, 5073.25, 5077.5, and 5081.75
Downside trades- Two options
- Failed retest of resistance level – 5050.25
- Failed retest of support level – 5039.25
- Opening target ranges – 5046.75, 5043.25, 5040.25, 5036.5, 5031.5, 5025, 5021.50, 5018.25, 5014.75, 5011.25, 5005.75, and 4997.75
Crude Oil –WTI
West Texas Intermediate remains range bound and is moving from support levels to resistance levels. The chart needs a significant catalyst to expand in either direction.
Buying pressure will likely strengthen with a positive retest of 53.49, while selling pressure will strengthen with a failed retest of 51.78.
Price resistance sits near 53.3 to 53.49, with 53.8 and 54.18 above that. Price support holds between 52.05 and 51.78, with 51.6 and 51.4 below that.
Upside trades – Two options
- Positive retest of continuation level – 52.85-congestion makes the breakout troublesome
- Positive retest of support level – 52.46
- Opening target ranges – 52.63, 52.84, 53.2, 53.46, 53.86, 54.16, 54.28, 54.51, 54.76, 55.06, and 55.24
Downside trades- Two options
- Failed retest of resistance level – 52.7
- Failed retest of support level – 52.3
- Opening target ranges – 52.45, 52.27, 52.08, 51.78, 51.52, 51.24, 51.04, 50.82, 50.47, 50.3, and 50.16
If you’re interested in watching these trades go live, join us in the live trading room from 9am to 11:30am each trading day.
Visit TheTradingBook for more information.
If you’re interested in the live trading room, it is now primarily stock market futures content, though we do track heavily traded stocks and their likely daily trajectories as well – we begin at 9am with a morning report and likely chart movements along with trade setups for the day.
As long as the trader keeps himself aware of support and resistance levels, risk can be very adequately managed to play in either direction as bottom picking remains a behavior pattern that is developing with value buyers and speculative traders.
Twitter: @AnneMarieTrades
The author trades stock market futures every day and may have a position in mentioned securities at the time of publication. Any opinions expressed herein are solely those of the author, and do not in any way represent the views or opinions of any other person or entity.

: Showing Some Signs of Emerging Strength")

